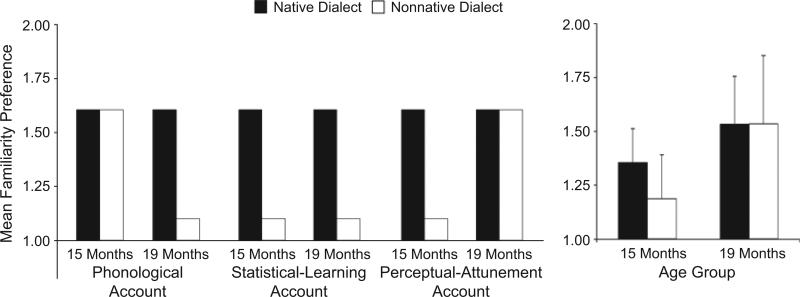
Fig. 1.
Idealized and observed listening preferences for the native and nonnative dialects at ages 15 and 19 months. The graphs show mean familiarity preference, the ratio of fixation times across familiar-word trials to fixation times across unfamiliar-word trials. Idealized results according to three theoretical accounts are presented in the left panel. Observed listening preferences are presented in the right panel; the error bars represent standard errors of the means.

