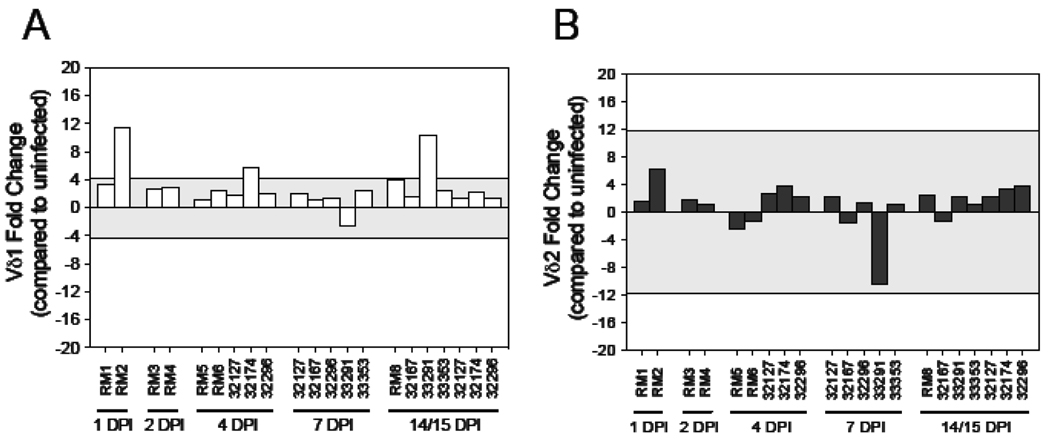
Figure 4. Assessment of Vδ1 and Vδ2 mRNA levels within the peripheral blood during acute SIV infection.
Quantitative real-time PCR was utilized to assess the mRNA levels of (A) Vδ1 and (B) Vδ2 in PBMC obtained from macaques analyzed throughout this study (RM1 – RM6) as well as from other macaques that had been orally inoculated with the same SIV isolate from which blood samples were available. Timepoints examined include 1 day post-infection (DPI), 2 DPI, 4 DPI, 7 DPI and 14–15 DPI. The mRNA levels shown are reported as fold change with regard to the average of mRNA levels in matched samples of seven uninfected macaques. The grey shaded area represents a two standard deviation range of the average expression from uninfected macaques. Bars extending beyond the grey shaded area represent samples that are increased or decreased with regard to the uninfected controls.

