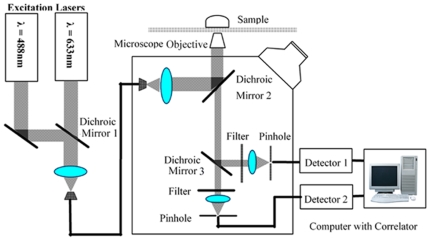
Figure 1. Schematic of the fluorescence correlation spectrometer.
An argon-ion laser (488 nm) and a helium-neon laser (633 nm) are used for the excitation of the RG dye and the Cy5 dye in the DNA sample through Dichroic Mirrors 1 and 2. The sample is contained in a chamber with a cover glass and is placed on the stage of an inverted microscope. Fluorescent light from the sample is collected by a high numerical aperture objective lens and transmitted by Dichroic Mirror 2. After passing through Dichroic Mirror 3, the residual laser excitation light and Raman scattered light are removed by additional band-pass filters. Green fluorescence between 505 nm and 550 nm is recorded by Detector 1 and red fluorescence above 650 nm is recorded by Detector 2. A computer was used to control the instrument and to obtain the auto- and cross-correlation functions of the fluorescent intensities, using the counted photoelectron pulses.

