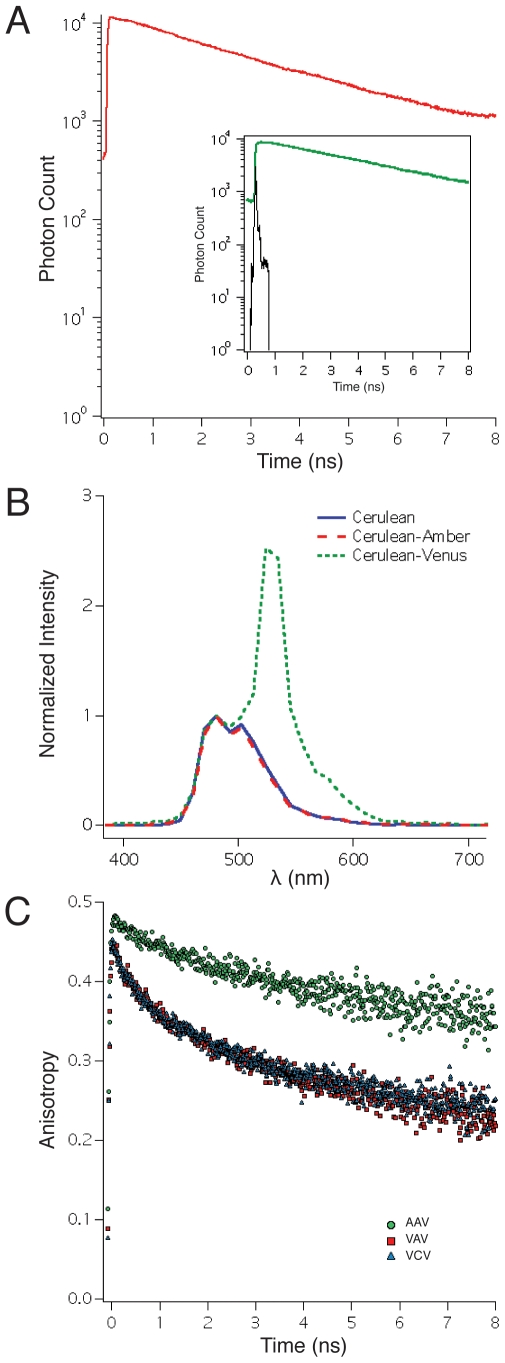
Figure 1. The Lifetime of Cerulean when flanked by two Amber molecules.
A. The fluorescence lifetime of Cerulean in the ACA construct was measured by time-correlated single photon counting (RED trace is the mean of traces observed in 5 different cells expressing ACA). Fluorescein at pH 10 was used as a lifetime standard to validate the accuracy of our instrumentation and its fluorescence lifetime decay is depicted in the inset (GREEN trace, mean of 3 measurements). The instrument response function of our FLIM system is also depicted in the inset (BLACK trace). B. The normalized emission spectrum of cells transfected with either Cerulean (BLUE trace), Cerulean attached to Amber (RED dashed trace), or Cerulean attached to Venus (GREEN dotted trace). Each trace is the average of 3 cells, and all samples were excited with two-photon excitation at 820 nm. Traces were normalized to the peak of the Cerulean emission at 481 nm. C. The time resolved fluorescence anisotropy decay of Venus in cells transfected with AAV (GREEN circles), VAV (RED squares), or VCV (BLUE triangles). Each point is the mean of 10 cells excited at 950 nm.

