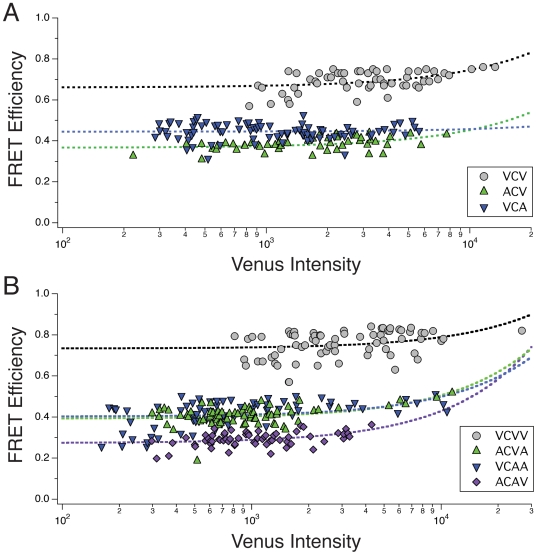
Figure 4. Estimating the intramolecular FRET efficiency.
E-FRET was used to measure the FRET efficiencies and the acceptor intensity (Venus) for each cell expressing members of the VCV series (A; VCV, ACV, and VCA) or the VCVV series (B; VCVV, ACVA, VCAA, ACAV), and these values are plotted as a function of the exposure normalized Venus intensity. Dashed lines indicates linear regression fitting for each data set to calculate the y-intercept as an estimate of the amount of intramolecular FRET in the absence of intermolecular FRET. Note that the data is plotted on a semi-log scale to more easily reveal the full range of the Venus intensity, but in so doing make linear plots appear curved.

