Abstract
Spectral domain optical coherence tomography (SDOCT) images have been used to investigate the mechanism of optical clearing in flowing blood using dextrans. The depth reflectivity profiles from SDOCT indicate that dextrans become increasingly more effective in reducing scattering in flowing blood, except for 5 mgdl−1 of D×500, with increasing molecular weights (MW 70,000 and 500,000) and concentrations (0.6, 2, and 5 mgdl−1). Among the tested dextrans, D×500 at 2 mgdl−1 had the most significant effect on light scattering reduction with the strongest capability to induce erythrocyte aggregation. D×500 at 5 mgdl−1 contributes more refractive index matching but induces a decrease in aggregation that leads to the same level as 0.6 mgdl−1 D×500. Previous studies identified various mechanisms of light scattering reduction in stationary blood induced by optical clearing agents. Our results suggest that erythrocyte aggregation is a more important mechanism for optical clearing in flowing blood using dextrans, providing a rational design basis for effective flowing blood optical clearing, which is essential for improving OCT imaging capability through flowing blood.
Keywords: dextran, optical clearing, human blood, erythrocyte aggregation, optical coherence tomography
1 Introduction
Optical coherence tomography (OCT) is a powerful optical imaging technique based on low coherence interferometry that allows imaging of microstructures beneath the tissue surface. Recently, endovascular OCT has proven to be valuable in imaging the vascular system for diagnosing atherosclerotic plaque or other vascular diseases and optimizing endovascular therapy and surgery in vivo.1–3 However, intra-vascular OCT imaging is complicated because blood causes substantial attenuation of the optical signal. Saline infusion is required during imaging. Minimization of the need for continuous saline infusion would represent a substantial advance for endovascular imaging techniques.
Optically, blood is a scattering system that consists of scattering particles—for example, red blood cells (RBCs), their aggregates, and the surrounding media, i.e., plasma. The refractive index mismatching between RBC cytoplasm and blood plasma is the major source of light scattering in blood. The scattering properties of blood also depend on RBC volume, shape, and orientation, which are defined in part by blood plasma osmolarity,4 aggregation and disaggregation capability, and hematocrit.5 Under normal physiological conditions, RBCs may aggregate into rouleaux. The rouleaux may further interact with other rouleaux to form rouleaux networks (or clumps, in pathological cases). The degree of aggregation depends on the blood flow rate. No aggregation forms in fast-flowing blood due to its great shear rate.6 Thus, the optical properties of blood are affected by the refractive index mismatching and the size and conformation of the aggregates, which change at different flow rates.
Recently, dextran (Dx) was used to increase the refractive index of plasma to achieve an index matching environment for blood samples. This led to a significant improvement in light penetration through circulating blood, reproducing coronary flow for OCT imaging.7 Our previous OCT study demonstrated that dextrans with various molecular weights (MWs) led to optical clearing in stationary blood samples from 52.1% to 150.5%.8,9 The optical properties of blood are altered by two effects induced by dextrans: refractive index matching and erythrocyte aggregation.9–11 However, the effect of erythrocyte aggregation on optical clearing of blood was not mentioned in Brezinski’s work,7 where only index matching was discussed for circulation of blood in a high flow rate using only one dextran with MW 70 kDa. This difference suggests that the effect of dextran on optical clearing between stationary and circulating blood may be different. In circulating blood that reproduces coronary flow with a flow rate of 200 ml/min,7 the high shear rate probably ensured that the RBCs did not form aggregation. In addition, the aggregation capability of dextrans depends on their MWs; the efficiency of a dextran in producing aggregation in flowing blood increases with its molecular weight.12 Therefore, further investigation of dextrans with various MWs for optical clearing of blood in flow will help to improve understanding of the mechanisms and applications.
Dextrans, the neutral and biocompatible macromolecules, have been widely used in blood aggregation studies.13,14 It is important to understand whether and how index matching and aggregation will affect optical clearing. We examined whether erythrocyte aggregation induced by dextrans in circulating blood with a flow rate of 5 to 100 mm/s would affect optical clearing, and also defined the optimal type and concentration of dextrans for blood optical clearing in small vessels to improve OCT penetration. For this purpose, dextrans with various MWs and different concentrations were employed in the experiments and studied by the use of a spectral domain OCT (SDOCT) system. Recently, SDOCT has shown advantages in imaging speed and signal-to-noise ratio over time-domain OCT.15 Therefore, SDOCT would be a better method for blood measurement to eliminate the influence of blood cell sedimentation on scattering properties during acquisition.9
2 Materials and Methods
2.1 Preparation of Porcine Blood
The use of human blood for tests is considered disadvantageous due to the risk of infection, restricted availability, and relatively high cost. Bovine as well as porcine blood is practical due to sufficient availability and adequate quantities. The properties of porcine blood are more similar to human blood than those of bovine blood, particularly in RBC aggregation tendency.16 Therefore, the results from blood tests with porcine blood can be regarded as a safe estimation for human blood. Thus, porcine blood samples were used in our studies. A hematocrit level of 45% was obtained by mixing fresh extracted RBCs with fresh porcine plasma using ethylene diamine tetraacetic acid (EDTA) as an anticoagulant (Animal Technologies, Inc., Tyler, Texas). Different suspensions of RBCs were resuspended in plasma without dextran (control) and with D×70 or D×500 (average molecular mass MW 70 and 500 kDa, Sigma, USA) at plasma dextran concentrations of 0.6, 2, and 5% (w/v), respectively. A plasma dextran (D×500) concentration of 0.6% (w/v) was used to induce RBC aggregation in the range for healthy humans and 2% to induce excessive aggregation.
2.2 SDOCT Measurement
A super-luminescent diode (SLD) with a spectrum centered at 1310 nm and a total delivered power of 8 mW was used. The FWHM of the source was about 95 nm, corresponding to a coherence length of ~8 µm. Approximately half of the power went to the sample arm. Back-reflected lights from the reference and sample arms were guided into a spectrometer and sampled by a 1 × 1024 line-scan camera at 7.7 kHz. The total wavelength range spreading on the detector array was 130 nm, corresponding to a spectral resolution of 0.13 nm and an imaging depth of 3.6 mm in vacuum.17
All OCT measurements were done just after RBC suspensions were prepared and pumped through a round glass capillary with a diameter of 300 or 600 µm (VitroCom Inc., Mountain Lakes, New Jersey). A programmable syringe pump (Harvard Apparatus, Holliston, Massachusetts) was used to flow the blood with an approximately constant speed rate of ~5 mm/sec within the glass capillary. In some experiments, the speed rate was ~10 and 100 mm/sec for blood samples with the hematocrit (HCT)=45% (the normal hematocrit in a human male). These parameters correspond to the characteristics of blood flow in small veins and small arteries with a diameter range of 0.2 to 1 mm. After each measurement, a small drop of blood sample from the end of the capillary was collected and smeared onto a glass slide for microscopy observation of aggregation. OCT “M-scans” (a single A-line repeatedly acquired in time without transverse scanning) were performed. Two thousand OCT depth reflectivity profiles (A-lines) were averaged for each data set.
According to the single scattering model, the attenuation coefficient (μt) of a sample can be obtained theoretically from reflectance measurements at two different depths,z1 and z2:
| (1) |
where Δz=|z1−z2 |, and R(z1) and R(z2) represent the reflectance at the depths z1 and z2, respectively.18 In this paper, data of μt were obtained by linear fitting of the slope of the average profile to minimize noise.19 Triplicate samples were measured and averaged for each data set. The decrease in attenuation by the addition of dextran was calculated according to
| (2) |
where the subscripts control and dextran refer to the blood samples without and with dextran, respectively.
It should be pointed out that in our previous studies, no significant fluctuations in hemoglobin concentration between the sample with dextran and the control were observed with the measurements of a B-hemoglobin photometer.8,9 Although the B-hemoglobin photometer is based on the principle of the absorption characteristic of blood in an 800-nm band, the hemoglobin absorption occurring in the wavelength region used in this study (1310 nm) may have had a negligible effect on the results because of its low absorption at 1310 nm. Changes in the attenuation of blood with dextran may be attributed to the decrease in scattering by the addition of dextran.
3 Results
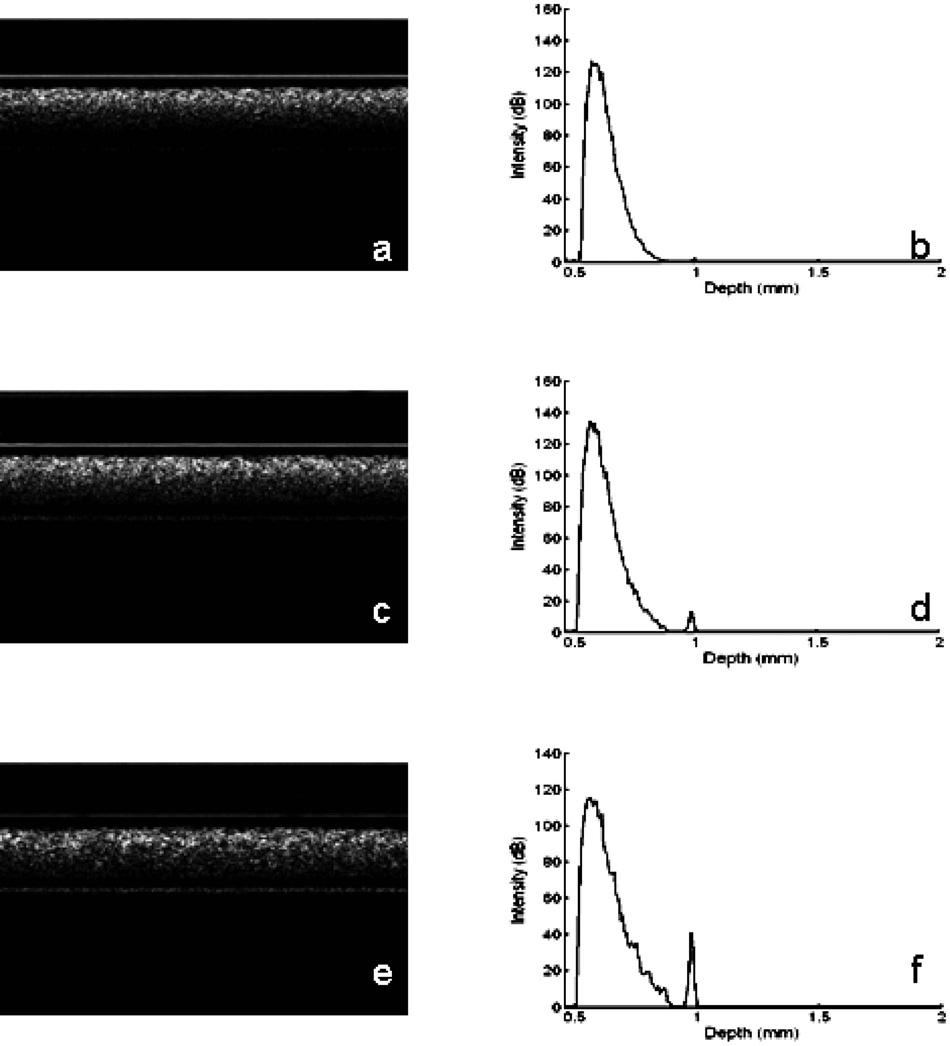
Figure 1 shows the representative OCT structure images [Figs. 1(a), 1(c), and 1(e)] and depth reflectivity profiles [Figs. 1(b), 1(d), and 1(f)] for fresh porcine blood without dextran [1(a) and 1(b)], and for blood with 0.6% D×500 [1(c) and 1(d)] and with 2% D×500 [1(e) and 1(f)] at HCT=45% flowing through a 600-µm glass capillary at a flow rate of 5 mm/sec. From the structural images, we can see that the OCT imaging depth was improved with the addition of dextran and dependent on the added concentration of D×500. Correspondingly, the slope of the OCT signal decreased in the depth reflectivity profiles, and the reflectance intensity as a sharp peak off the bottom glass surface increased with the addition of dextran, indicating attenuation in the blood was reduced by the dextrans.
Fig. 1.
Typical OCT images and corresponding 1D signal recorded from porcine blood (HCT=45%): (a) and (b) without dextran; (c) and (d) with 0.6% D×500; (e) and (f) with 2% D×500.
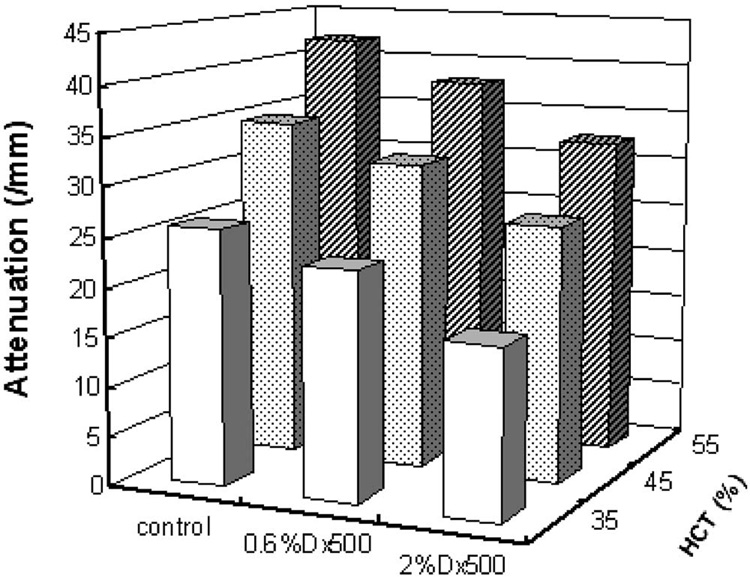
The scattering properties of the blood at the three HCTs of 35%, 45%, and 55% following the application of 0.6 and 2 gdl−1 D×500 were measured from OCT depth reflectivity profiles according to Eq. (1) and shown in Fig. 2. The blood was flowing through a 300-µm glass capillary at a rate of 5 mm/sec. As expected, attenuation in the blood increased with the HCT both in the control (RBCs with plasma but without dextran) and in the blood with D×500. For example, for the blood at H =35%, μt was measured at 25.9 mm−1 and increased to 34.7 and 42.2 mm−1 in the samples of 45% and 55%, respectively. The attenuation was reduced by the addition of 0.6 and 2 gdl−1 D×500 for all blood samples with various hematocrits. The reduction percentages were approximately 11 (34)%, 10 (25)%, and 10 (23)% for the blood samples with H = 35%, 45%, and 55%, respectively. It can be seen that the light attenuation decreased with the increase of added D×500 from 0.6 gdl−1 to 2 gdl−1 for the three HCTs, demonstrating the concentration-dependent effect of D×500 on attenuation reduction.
Fig. 2.
Summary of attenuation in the blood at HCT=35%, 45%, and 55% without and with D×500 at a flow rate of 5 mm/sec (n=3).
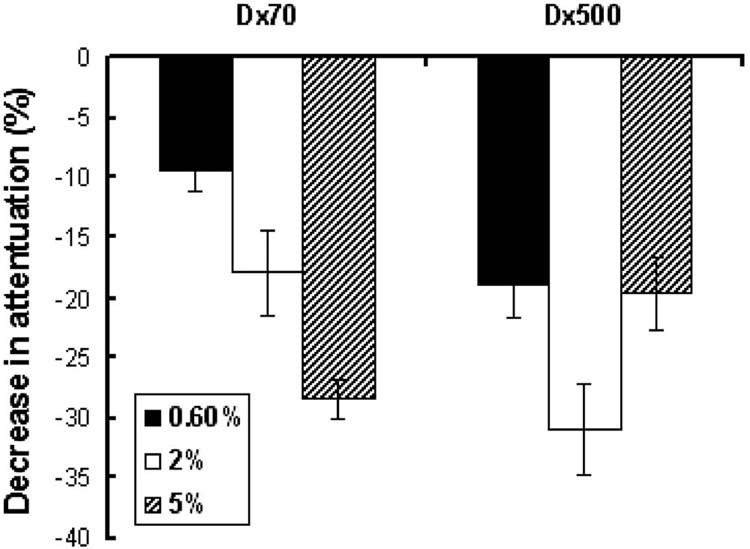
To define the optimal type and concentration of dextrans for blood optical clearing and to understand the mechanisms, we studied D×70, used in clinics as a plasma substitute, in comparison to D×500 for the blood (HCT=45%) flowing through a 600-µm glass capillary at a flow rate of 5 mm/sec. Figure 3 shows the decrease in attenuation caused by the addition of D×70 and D×500 at concentrations of 0.6, 2, and 5 gdl−1 compared to the control group. Similarly, the effect was dependent on the concentration of D×70 at 0.6 to 5 gdl−1 and for D×500 at 0.6 to 2 gdl−1. The greatest decrease in attenuation was approximately 28% and 31% for the blood samples with D×70 at 5 gdl−1 and D×500 at 2 gdl−1, respectively, which are 3-fold (D×70) and 1.6-fold (D×500) to that at 0.6 gdl−1. Figure 3 also shows that a dextran with a higher MW (D×500) was more effective than that with a lower MW (D×70) at the same concentration of 0.6 or 2 gdl−1 by 2-fold and 1.7-fold, respectively. Contrary to the concentration and MW-dependent effects D×500 at 5 gdl−1 resulted in the same low level as that at 0.6 gdl−1. This discrepancy is discussed below.
Fig. 3.
Attenuation reduction in the blood (HCT=45%) induced by D×70 and D×500 at concentrations of 0.6, 2, and 5 mgdl−1 (n=3).
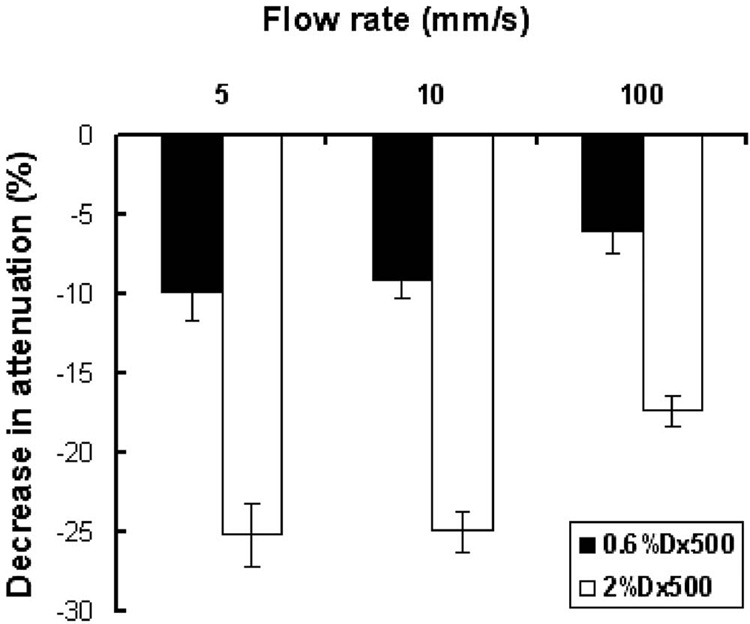
Figure 4 shows the attenuation reduction (Δμt) calculated according to Eq. (2) in the blood (HCT=45%) by D×500 at the three flow rates of 5, 10, and 100 mm/sec. There were no significant differences in attenuation reduction (Δμt) between the low-rate flows of 5 and 10 mm/sec for both the blood samples with 0.6 or 2 mgdl−1 of D×500. The level of attenuation reduction in the blood with both concentrations of D×500 at 100 mm/sec was much smaller than at 5 and 10 mm/sec.
Fig. 4.
Attenuation reduction in blood (HCT=45%) induced by D×500 at flow rates of 5, 10, and 100 mm/s (n=3).
4 Discussion
It can be seen that for all blood samples in the low-rate flow with various HCTs, both types of dextrans can induce optical clearing and become increasingly effective in reducing attenuation with increased blood dextran levels, except 5 gdl−1 D×500 (Fig. 2 and Fig. 3). The changes in the scattering property by the addition of dextran are explained first by the refractive index matching mechanism.9,10 The predominant source of scattering in blood is the difference in the refractive indexes between the cytoplasm of RBCs (nbc~1.405) and plasma (nbc~1.345).20 The refractive index (1.337) of the porcine blood plasma in this study was increased to 1.342, 1.349, and 1.361 with the addition of dextrans at 0.6, 2, and 5 gdl−1 as measured by the OCT system.9 When the index of scatterers remains constant, it results in a decrease of the index ratio (m, m=nbc/nbp), and thereby, of the scattering coefficient. Therefore, it is understandable that the higher the concentration of dextran, the higher the capability of blood optical clearing will be because more index-matching environments are created by dextran.
The results demonstrate that the higher the molecular weight of dextran, the more pronounced the optical clearing capability in the blood (Fig. 3). Insight into the significant differences in optical clearing capability can be gained by comparison of two types of dextrans at the same concentration of either 0.6 or 2 gdl−1, which have the same refractive index when the concentrations are the same. D×500 at 2 gdl−1 with a smaller plasma refractive index achieves the same clearing effect as D×70 at 5 gdl−1. In addition, blood with 5 gdl−1 D×500 has the largest plasma refractive index (1.361) but shows the same clearing level as 0.6 gdl−1. Obviously, these results cannot be explained by the refractive index matching mechanism.
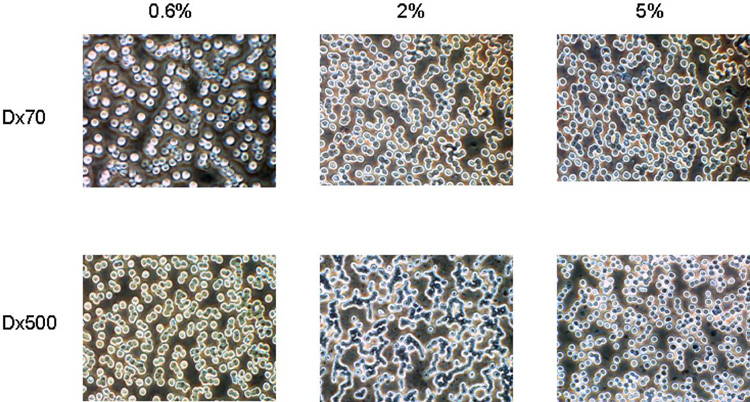
Furthermore, as demonstrated in Fig. 5 by the blood smear microscopy, cellular aggregation is observed in the low-rate blood flow. D×500 is much more effective in producing RBC aggregation than D×70 at the same concentration of 0.6 or 2 gdl−1. In other words, dextran efficiency in producing aggregation in the flowing blood increases with MW. It is in agreement with previous findings that the increase in MW of dextrans would increase the aggregation capability.21 In addition, RBC aggregation becomes more pronounced with increased concentration for D×70 from 0.6 gdl−1 to 5 gdl−1, and for D×500 from 0.6 gdl−1 to 2 gdl−1. The greater aggregation produced by dextrans with a higher MW at a higher concentration in flowing blood may contribute to their greater capability for blood attenuation reduction, as shown in Fig. 2 and Fig. 3. D×500 at 2 mgdl−1 is the most effective agent in inducing RBC aggregation with rouleaux and rouleaux networks, as shown in Fig. 5, corresponding to its greater capability for blood optical clearing among the tested dextrans. However, although D×500 at 5 mgdl−1 contributes more refractive index matching, it leads to the same level as D×500 at 0.6 mgdl−1 (Fig. 3). The discrepancy could be explained by the biphasic effect of dextran on RBC aggregation. It is well known that RBC aggregation occurs only within a certain range of concentrations that are characteristic of dextran fractions. An increase in dextran concentration causes an increase in aggregation up to an optimum concentration, beyond which the further addition of dextran results in a decrease of aggregation or in disaggregation.22 Figure 5 does show that the blood in 5 mgdl−1 D×500 has a similar aggregation level to the blood in 0.6 mgdl−1 D×500.
Fig. 5.
Smear microscopy images for blood (HCT=45%) with D×70 and with D×500 at concentrations of 0.6, 2, and 5 mgdl−1 at a flow rate of 5 mm/sec. Dextran efficiency in inducing aggregation increases with MW. (Color online only)
Contrary to the result from the stationary blood in our previous study,9 where D×500 at 0.5 gdl−1 was the optimum concentration for the stationary blood samples to enhance light transmittance, the above results suggest that D×500 at 2 gdl−1 would be the most effective agent among the tested dextrans for optical clearing of blood in low-rate flow. It means that dextrans have higher optimum concentrations for producing aggregation of blood under flow than in stasis, i.e., more dextrans are needed to induce aggregation in flowing blood. These results suggest that shear force does decrease the aggregation capability of dextrans.
Another set of experiments comparing blood in various shear forces further demonstrates the effect of RBC aggregation on the blood optical clearing effect. The attenuation reduction (Δμt) in blood with both concentrations of D×500 at 100 mm/sec is less pronounced than at 5 or 10 mm/sec (Fig. 4), indicating that less aggregation was produced at a higher shear rate while the refractive index matching remained the same among the various flow rates. Less aggregation of blood at 100 mm/sec is observed in the blood smear microscopy (images not shown). It can be deduced that more concentrated dextran is needed to achieve the same clearing effect, e.g., the optimum concentration should be greater than 2 gdl−1 at a higher flow rate. Although a difference in aggregation capability of dextrans for blood in stasis9 and in various flows exists, erythrocyte aggregation induced by dextrans is attributed more to optical clearing of the blood in low-rate flow. It has been reported that a decrease in diffusing surfaces because of aggregation accounts for the decrease of the backscattered signal and the increase of light transmission.23,24 It should be noted that this study does not provide quantitative aggregation parameters in the flowing blood. It is evident that quantitating erythrocyte aggregation at various flow rates for comparison deserves further investigation to produce more refined and definitive results. Decreased scattering in flowing blood due to erythrocyte aggregation is hypothesized to occur in tissue, which may allow enhanced OCT imaging. However, further work is needed to prove this hypothesis in living tissues and to study erythrocyte aggregation in living tissues for in vivo use.
It should be taken into account that the changes in RBC volume and deformation may be influencing factors in optical clearing of flowing blood by the addition of dextrans. As observed by blood smear microscopy, cell deformation actually took place when the blood sample was in flow with a high rate for both sample groups, i.e., blood with dextran and the control group. According to Roggan,4 shear-stress-induced cell deformation could be neglected with respect to the scattering properties. Another result caused by shear stress created by the flow is cell axial migration, which was found to be the predominant factor affecting optical properties with respect to flow parameters.4 A study performed by Enejder et al.6 revealed that increasing the degree of cell alignment and elongation as a result of increasing the shear rate reduced both and μa. However, the influence of cell alignment and elongation of RBCs in the low-rate flow of 5 mm/sec in this work could be negligible because such a small shear rate would not cause significant changes.
5 Conclusions
The optical clearing of blood in low-rate flow by dextrans was tested with a designed system that pumped blood through thin transparent tubing. Dextran with various MWs and at different concentrations was investigated by OCT measurement of the attenuation coefficient of the blood. With increasing MWs and concentrations up to an optimum, dextran became increasingly more effective in reducing scattering; D×500 at 2 mgdl−1 resulted in the most significant improvement. We conclude that the blood optical clearing effect in flow is strongly dependent on erythrocyte aggregation. This study demonstrates that optical clearing by dextrans is useful for improving OCT imaging through flowing blood and provides a rational design basis for effective optical clearing of flowing blood.
Acknowledgments
This work was supported by research grants from the National Institutes of Health (EB-00293, CA-91717, and RR-01192); the Air Force Office of Scientific Research (FA9550-0401-0101); the Beckman Laser Institute Endowment; the National Natural Science Foundation of China (30470426); and the Zhejiang Provincial Natural Science Foundation (X206958).
This work was performed at Dr. Zhongping Chen’s OCT lab, Beckman Laser Institute, University of California, Irvine, USA, while Dr. Xiangqun Xu was working there as an academic visitor.
Contributor Information
Xiangqun Xu, Email: xuxiangqun@zstu.edu.cn, Zhejiang Sci-Tech University, School of Science, Hangzhou 310018, China.
Lingfeng Yu, University of California, Beckman Laser Institute, Irvine, California 92612.
Zhongping Chen, University of California, Beckman Laser Institute, Irvine, California 92612.
References
- 1.Brezinski ME, Tearney GJ, Bouma BE, Izatt JA, Hee MR, Swanson EA, Southern JF, Fujimoto JG. Optical coherence tomography for optical biopsy: properties and demonstration of vascular pathology. Circulation. 1999;93:1206–1213. doi: 10.1161/01.cir.93.6.1206. [DOI] [PubMed] [Google Scholar]
- 2.Fujimoto JG, Boppart SA, Tearney GJ, Bouma BE, Pitris C, Brezinski ME. High resolution in vivo intraarterial imaging with optical coherence tomography. Heart. 1999;82:128–133. doi: 10.1136/hrt.82.2.128. [DOI] [PMC free article] [PubMed] [Google Scholar]
- 3.Patwari P, Weissman NJ, Boppart SA, Jesser CA, Stamper D, Fujimoto JG, Brezinski ME. Assessment of coronary plaque with optical coherence tomography and high frequency ultrasound. Am. J. Cardiol. 2000;85:641–644. doi: 10.1016/s0002-9149(99)00825-5. [DOI] [PubMed] [Google Scholar]
- 4.Roggan A, Friebel M, Dorschel K, Hahn A, Mueller G. Optical properties of circulating human blood in the wavelength range 400–2500 nm. J. Biomed. Opt. 1999;4:36–46. doi: 10.1117/1.429919. [DOI] [PubMed] [Google Scholar]
- 5.Priezzhev AV, Ryaboshapka OM, Firsov NN, Sirko IV. Aggregation and disaggregation of erythrocytes in whole blood: study by backscattering technique. J. Biomed. Opt. 1999;4:76–84. doi: 10.1117/1.429923. [DOI] [PubMed] [Google Scholar]
- 6.Enejder AMK, Swartling J, Aruna P, Andersson-Engels S. Influence of cell shape and aggregate formation on the optical properties of flowing whole blood. Appl. Opt. 2003;42(7):1384–1394. doi: 10.1364/ao.42.001384. [DOI] [PubMed] [Google Scholar]
- 7.Brezinski M, Saunders K, Jesser C, Li X, Fujimoto JG. Index matching to improve OCT imaging through blood. Circulation. 2001;103:1999–2003. doi: 10.1161/01.cir.103.15.1999. [DOI] [PubMed] [Google Scholar]
- 8.Tuchin VV, Xu X, Wang RK. Dynamic optical coherence tomography in optical clearing, sedimentation and aggregation study of immersed blood. Appl. Opt. 2002;41:258–271. doi: 10.1364/ao.41.000258. [DOI] [PubMed] [Google Scholar]
- 9.Xu X, Wang RK, Elder JB, Tuchin VV. Effect of dextran-induced changes in refractive index and aggregation on optical properties of whole blood. Phys. Med. Biol. 2003;48:1205–1221. doi: 10.1088/0031-9155/48/9/309. [DOI] [PubMed] [Google Scholar]
- 10.Tuchin VV. Optical clearing of tissue and blood. Bellingham, Washington: SPIE Press; 2005. PM 154. [Google Scholar]
- 11.Yu Kirillin M, Priezzhev AV, Tuchin VV, Wang RK, Myllylä R. Effect of red blood cell aggregation and sedimentation on optical coherence tomography signals from blood samples. J. Phys. D. 2005;38:2582–2598. [Google Scholar]
- 12.Barshtein G, Tamir I, Yedgar S. Red blood cell rouleaux formation in dextran solution dependence on polymer conformation. Eur. Biophys. J. 1998;27:177–181. doi: 10.1007/s002490050124. [DOI] [PubMed] [Google Scholar]
- 13.Chen S, Gavish B, Zhang S, Mahler Y, Yedgar S. Monitoring of erythrocyte aggregate morphology under flow by computerized image analysis. Biorheology. 1995;32(4):487–496. doi: 10.1016/0006-355X(95)00025-5. [DOI] [PubMed] [Google Scholar]
- 14.Bertoluzzo SM, Bollini A, Rsia M, Raynal A. Kinetic model for erythrocyte aggregation. Blood Cells Mol. Dis. 1999;25(22):339–349. doi: 10.1006/bcmd.1999.0261. [DOI] [PubMed] [Google Scholar]
- 15.Leitgeb RA, Hitzenberger CK, Fercher AF. Performance of fourier domain vs. time domain optical coherence tomography. Opt. Express. 2003;11:889–894. doi: 10.1364/oe.11.000889. [DOI] [PubMed] [Google Scholar]
- 16.Cardoso AV, Camargos AO. Geometrical aspects during formation of compact aggregates of red blood cells. Mater. Res. 2002;5(3):263–268. [Google Scholar]
- 17.Yu L, Rao B, Zhang J, Su J, Wang Q, Guo S, Chen Z. Improved lateral resolution in optical coherence tomography by digital focusing using two-dimensional numerical diffraction method. Opt. Express. 2007;15:7634–7641. doi: 10.1364/oe.15.007634. [DOI] [PubMed] [Google Scholar]
- 18.Schmitt JM, Knüttel A, Bonner RF. Measurement of optical properties of biological tissues by low-coherence reflectometry. Appl. Opt. 1993;32(30):6032–6042. doi: 10.1364/AO.32.006032. [DOI] [PubMed] [Google Scholar]
- 19.Xu X, Wang RK. The role of water desorption on optical clearing of biotissue: studied with near infrared reflectance spectroscopy. Med. Phys. 2003;30:1246–1253. doi: 10.1118/1.1576228. [DOI] [PubMed] [Google Scholar]
- 20.Nilsson AMK, Alsholm P, Karlsson A, Andersson-Engels S. T-matrix computations of light scattering by red blood cells. Appl. Opt. 1998;37:2735–2748. doi: 10.1364/ao.37.002735. [DOI] [PubMed] [Google Scholar]
- 21.Chien S, Jan K. Ultrastructure basis of the mechanism of rouleaux formation. Microvasc. Res. 1973;5:155–166. doi: 10.1016/0026-2862(73)90068-x. [DOI] [PubMed] [Google Scholar]
- 22.Gasper Rosa A, Thurston GB. Erythrocyte aggregate rheology by transmitted and reflected light. Biorheology. 1998;25:471–487. doi: 10.3233/bir-1988-25308. [DOI] [PubMed] [Google Scholar]
- 23.Tsinopoulos SV, Sellountos EJ, Polyzos D. Light scattering by aggregated red blood cells. Appl. Opt. 2002;41(7):1408–1417. doi: 10.1364/ao.41.001408. [DOI] [PubMed] [Google Scholar]
- 24.Gandjbakhche AH, Mills P, Snabre P. Light-scattering technique for the study of orientation and deformation of red blood cells in a concentrated suspension. Appl. Opt. 1994;33(6):1070–1078. doi: 10.1364/AO.33.001070. [DOI] [PubMed] [Google Scholar]


