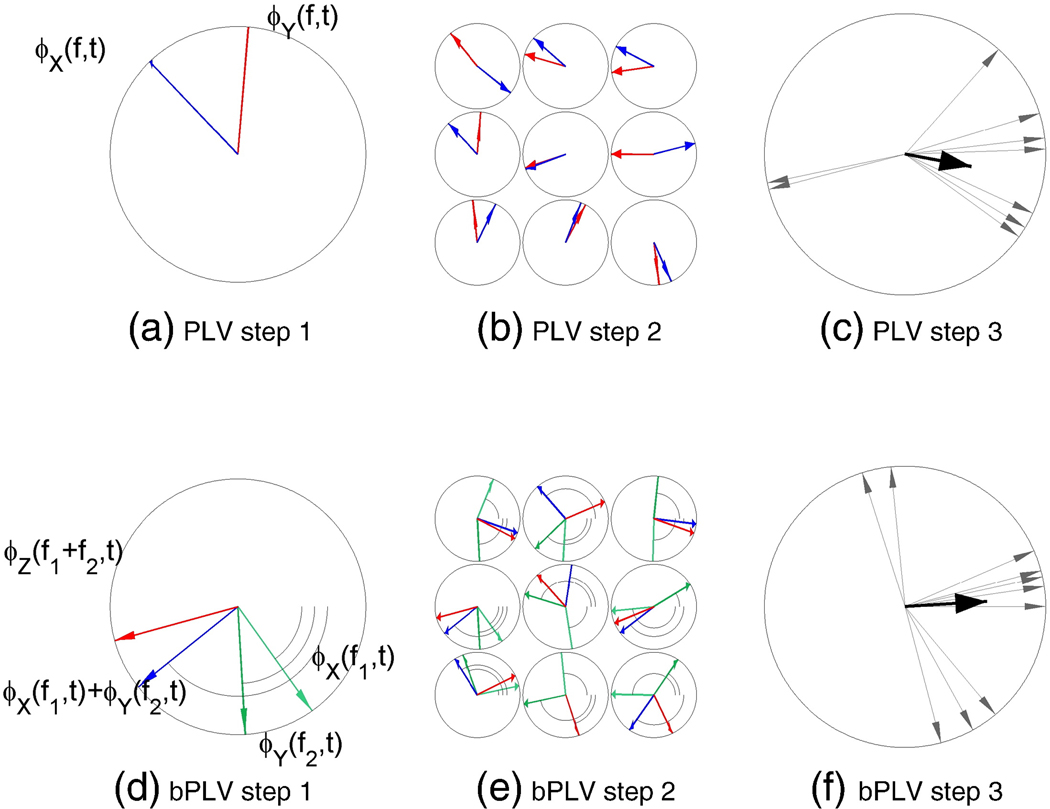
Fig. 1.
Comparison of the phase locking value (PLV) computation with the biphase locking value (bPLV) computation. The PLV measures the correlation between the phases of two signals at the same frequency f. The bPLV measures the correlation between the phases of three signals at three different frequencies f1,f2, and f3 that are related by f1 + f2 = f3. (a) PLV Step 1. The phase of the signal (shown by blue arrows) and the phase of the signal Yi (t), ϕiY (f, t) (shown by red arrows) are extracted from the data for each single trial i at frequency f. (b) PLV Step 2. The phase difference is then computed for each trial i. (c) PLV Step 3. The PLV is computed as the mean of the single trial phase differences . The single trial phase differences are shown by grey arrows and their mean is shown by the black arrow. (d) bPLV Step 1. The phase of signal (shown by blue arrows), the phase of signal (shown by green arrows), and the phase of signal (shown by red arrows) are extracted from the data for each single trial i. (e) bPLV Step 2. The phase difference is then computed for each trial i. (f) bPLV Step 3. The bPLV is computed as the mean of the single trial phase differences . The single trial phase differences are shown by grey arrows and their mean is shown by the black arrow.

