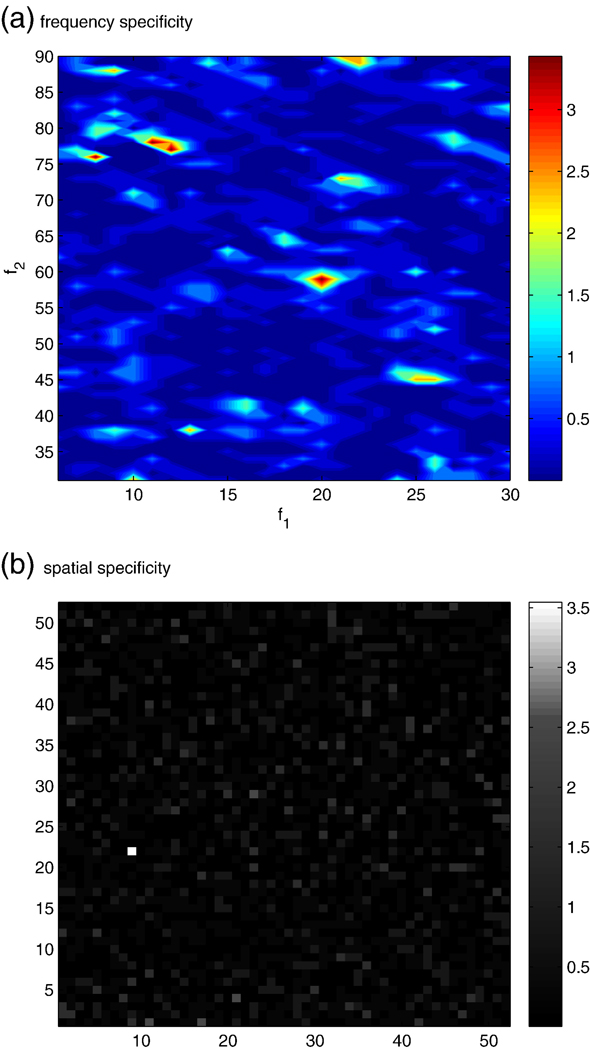
Fig. 11.
(a) The frequency-by-frequency map of the p-values of the threshold crossings for the selected pre-motor to motor interaction. A negative log scale was used (base 10). (b) The channel by channel p-value map of the threshold crossings during movement for the bPLV interaction at (12,77) Hz. The coordinates of the selected channels in pre-motor and motor cortex are (9,22), where the map shows the lowest p-value. A negative log scale was used. This shows that the observed bPLV coupling is specific in space, i.e. the selected electrode pair, and frequency.

