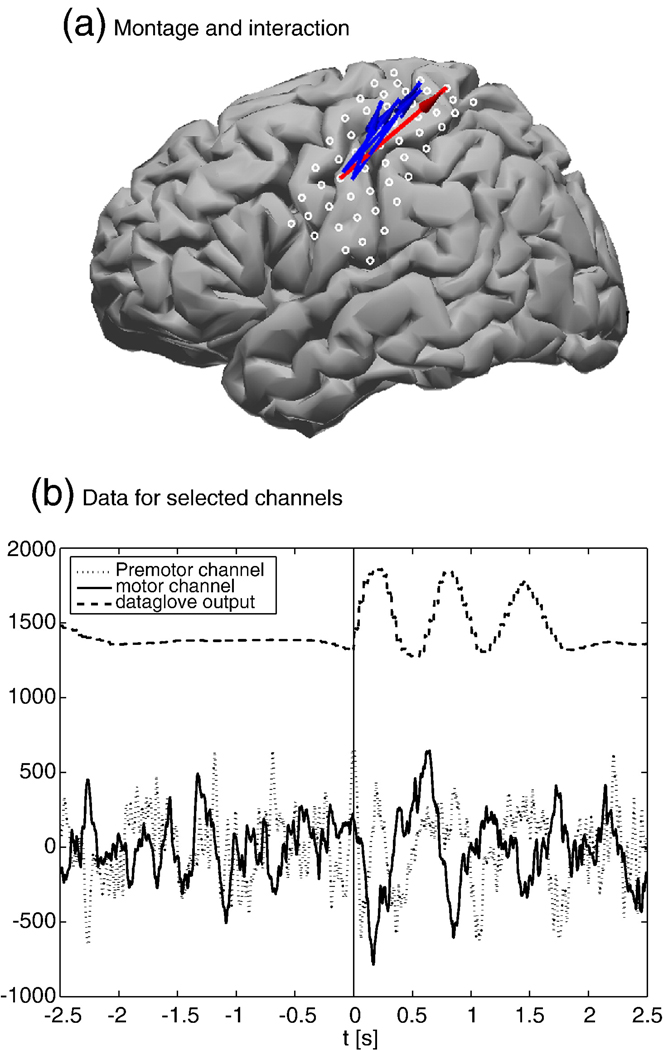
Fig. 7.
(a) The electrode placement for the subject in Talairach space, using a generic cortical surface, and the previously identified interaction sites during thumb movement. The blue arrows show interactions found in four other subjects, projected into the same coordinate system. The red arrow shows the interaction for the current study between a pre-motor and a motor region. (b) The average time course for these regions, along with the data glove output. The solid and dotted lines show the mean ECoG traces and the dashed line the mean data glove output. The bPLV interaction between these two channels cannot be readily seen in the time-domain.

