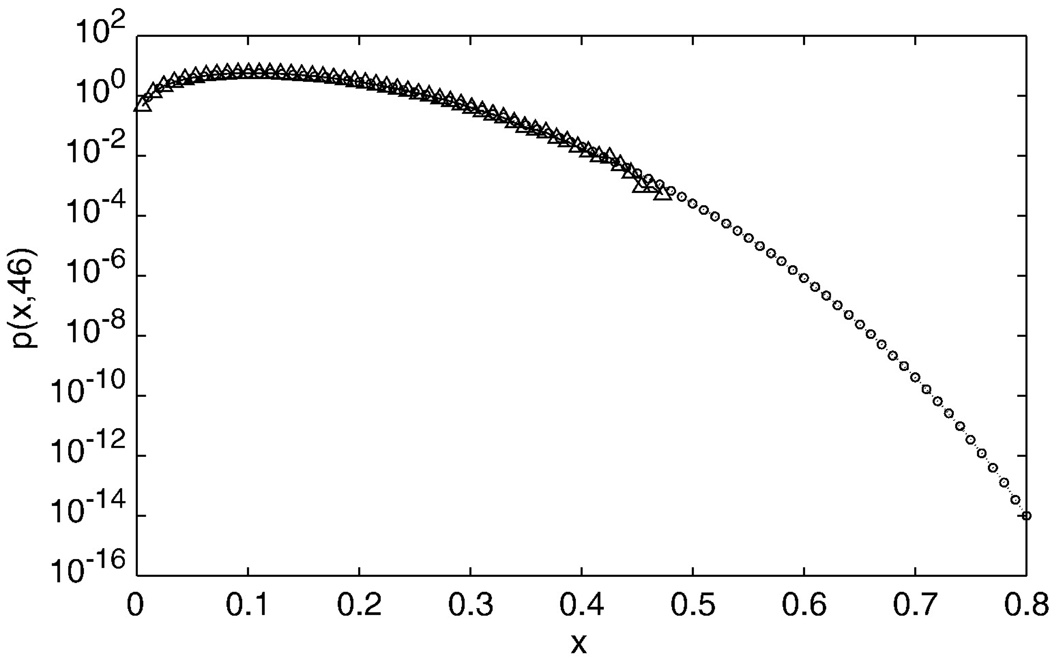
Fig. 9.
Comparison of the theoretical pdf of the bPLV based on Eq.2 and the distribution of the bPLV between all channel pairs for the premovement segment. Circles show the theoretical prediction; triangles show the results of the actual data. Note that a log scale is used on the y-axis. The curves match well, which implies that the bPLV between most cortical regions adheres to the random phase distribution. This justifies the use of the theoretical distribution as a baseline

