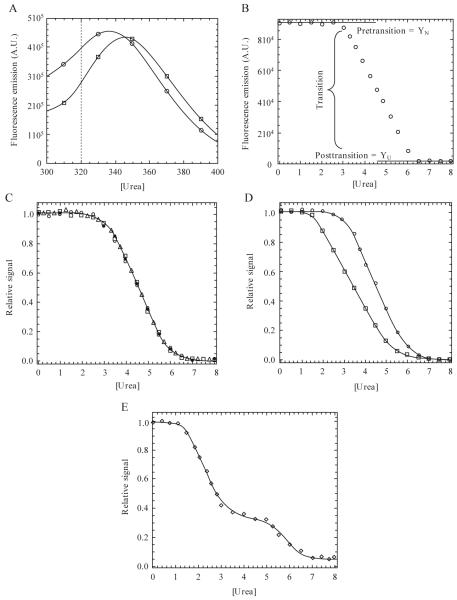
Figure 1.1.
(A) Emission spectra following excitation at 280 nm. Data for 0 M (○) and 8 M (□) urea are shown. In this example, the dotted line indicates a wavelength at which unfolding may be monitored due to a large difference in signal between the native and unfolded protein. (B) Equilibrium unfolding curve monitored by fluorescence emission at 320 nm (excitation at 280 nm). The pretransition, transition, and posttransition regions are indicated. (C) Normalized data demonstrating three probes used in the unfolding experiments. Unfolding was monitored by fluorescence emission following excitation at 280 nm (○) or 295 nm (□) or by CD (Δ). Refolded protein (●) demonstrates reversibility. (D) Noncoincidence of the unfolding curves when monitored by different spectroscopic techniques, suggesting a more complex folding mechanism than the two-state model suggested by a single technique. (E) Example of a three-state equilibrium-unfolding curve. Continuous lines in panels C-E represent fits of the data either to a two-state (panels C and D) or three-state (panel E) monomer unfolding model as described in the text.

