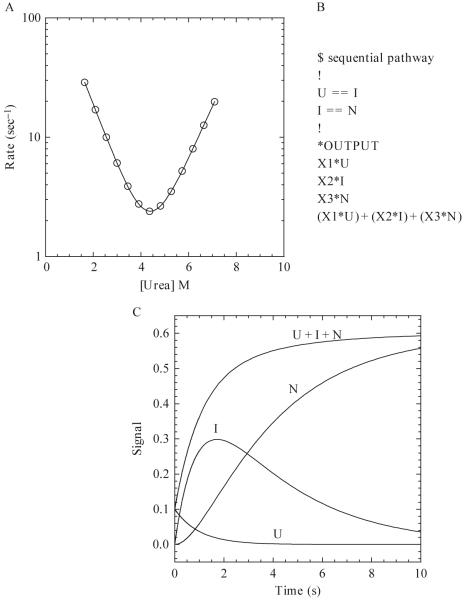
Figure 1.5.
(A) Hypothetical chevron plot of the apparent refolding and unfolding rates versus the final urea concentration. The continuous line represents a fit to a two-state kinetic folding model (Ferguson et al., 1999) with the following parameters: , , mN-TS = 0.7, mU-TS = 0.6, ΔGH2O = 5.62 kcal/mol, m-value = 1.3 kcal/mol/M, . (B) Example of a sequential pathway with one on-pathway intermediate written in the text format for KINSIM. X1, X2, and X3 are the extinction coefficients of U, I, and N, respectively. (C) Hypothetical example of a refolding reaction of 10 μM protein for 10 s. The populations of species, shown by the continuous lines, are labeled as U, I, N, and U + I + N. The rates of the U to I and I to N transitions are 1 and 0.3 sec-1, respectively. The values of X1, X2, and X3 are 0.01, 0.05, and 0.06, respectively.

