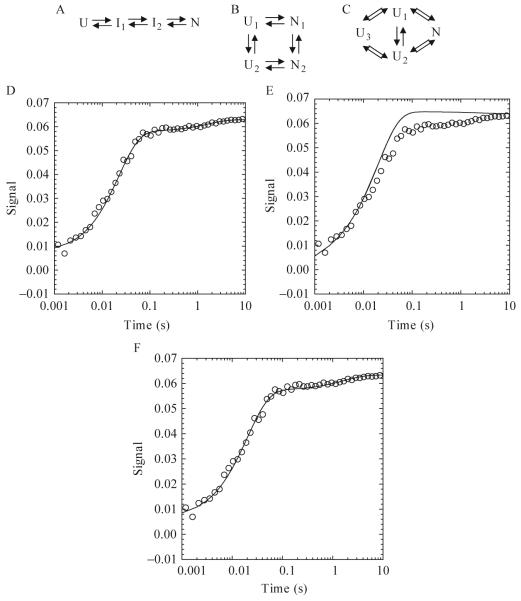
Figure 1.6.
One sequential (A) and two parallel folding pathways (B and C) used in KINSIM simulations. (A) The unfolded species folds through two intermediates before forming the native species. (B) Two unfolded and native species exist and interconvert. (C) Three unfolded species exist, where U1 and U2 fold to the native state and U3 interconverts with U1 or U2. (D-F) Plots of an Apaf-1 CARD refolding reaction in 3.64 M urea. KINSIM simulations for each plot are shown as a continuous line. For pathway A, the concentration of I1 was 10 μM. The extinction coefficient for U, I1,I2, and N were 0, 0.0007, 0.0058, and 0.0063, respectively. The rates for I1 to I2 and I2 to N were 45 and 0.6 sec-1, respectively. For pathway B, the concentrations of U1 and U2 were 1 and 9 μM, respectively. The extinction coefficients for N1 and N2 were 0.0074 and 0.0064. The rates of U1 to N1, U1 to U2, U2 to N2, and N1 to N2 were 500, 100, 50, and 0.4 sec-1, respectively. For pathway C, the concentrations of U1, U2, and U3 were 0.7, 8.3 and 1 μM. The extinction coefficient of N was 0.0086. The rates of U1 to N, U2 to N and U3 to U1 or U2 were 5000, 37 (back rate of 13) and 0.6 (back rate of 0.01) per second.

