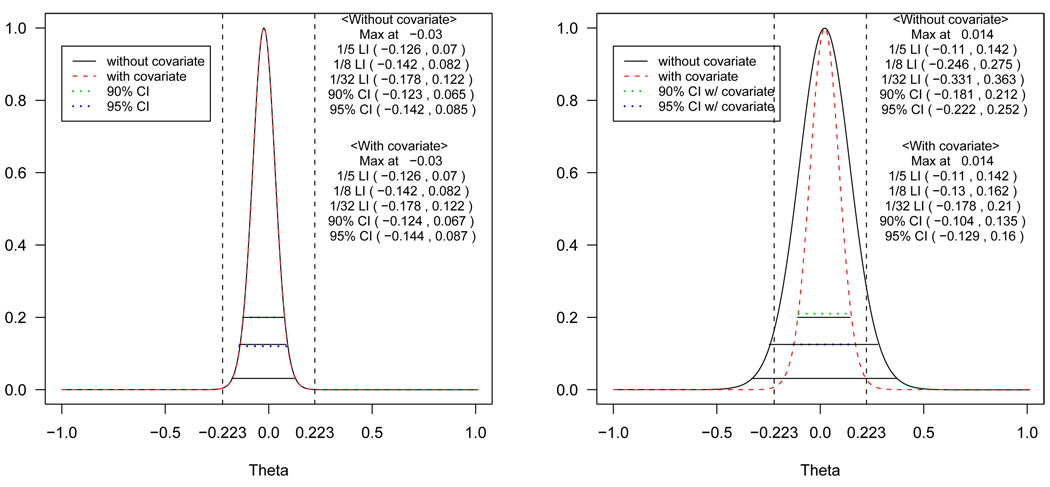
Figure 3.
The profile likelihoods with and without covariates, 1/5 (upper solid line), 1/8 (middle solid line) and 1/32 (lower solid line) likelihood intervals for the difference of means of log AUC using the data in Chow and Liu [34] (left panel) and the modified version of Chow and Liu’s data [34] where the values for the second period are inflated so that period effect exists (right panel). The horizontal dotted lines represent the 90% (upper) and 95% (lower) confidence interval estimated by a random effects models with and without covariates and the vertical lines represent the regulatory lower (δL) and upper (δU) limits.

