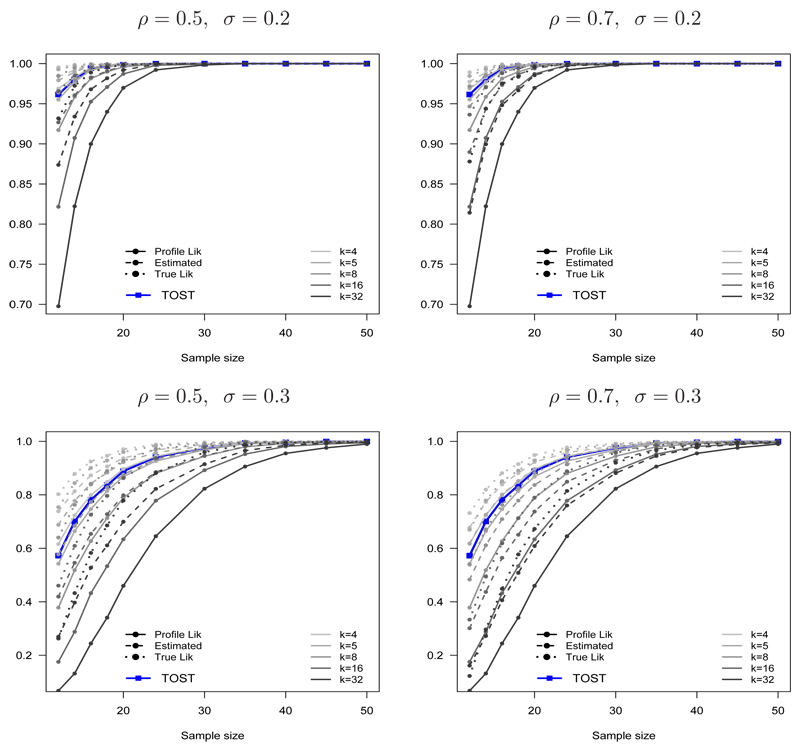
Figure 6.
The probability of correctly presenting bioequivalence using the true(PBE{LI(k) ⊂ (θL, θU)}), profile (PBE{LIP(k) ⊂ (θL, θU)}) and estimated (PBE{LIE(k) ⊂ (θL, θU)}) likelihood intervals when the two formulations are truly bioequivalent as a function of k = 4, 5, 8, 16, 32 for ρ = 0.5 (left panel), ρ = 0.7 (right panel), σ = 0.2 (top panel) and σ = 0.3 (bottom panel). The power for TOST is shown for comparison.

