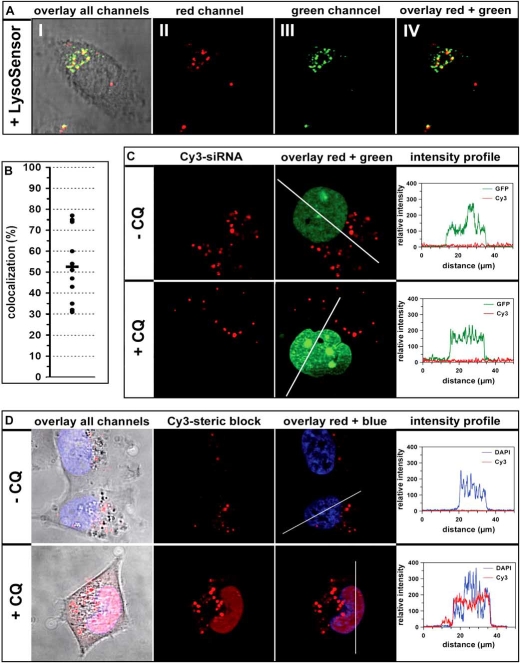
Fig. (4).
Confocal (A) and semiconfocal (C and D) microscopic analyses of intracellular RNA localization following peptide-mediated transfection. (A) Living ECV304 cells were transfected for 4 h with 4.2 µM MPGα and 10 nM Cy3-labeled siRNA. Subsequently cells were incubated with 5 µM LysoSensor (Invitrogen). (I) Overlay of the phase contrast image with all fluorescence channels, (II) Cy3-channel (siRNA - red), (III) LysoSensor channel (green) and (IV) overlay of red and green channel. Yellow dots indicate colocalization. (B) Quantitative analysis of siRNA/LysoSensor colocalization using the program ImageJ. For each data point 5 cells were analyzed and averaged. (C) Living ECV-GFP-Nuc cells [55] were transfected for 4 h with 4.2 µM MPGα and 10 nM Cy3-labeled siRNA in the absence and presence of 100 µM chloroquine (CQ).The left images show the red (siRNA) channels followed by an overlay of the red and green (nuclei) channels. The right panel shows plots of the intensity profiles for the green channel and the Cy3-channel along the line indicated in the figure to the left. (D) Living HeLa Luc/705 cells were transfected for 4 h with 2.5 µM MPGα and 278 nM Cy3-labeled ON-705 PTO in the absence and presence of 100 µM chloroquine (CQ). The very left images show an overlay of the phase contrast with all fluorescence channels followed by the red (steric block) and an overlay of the red and blue (nuclei) channels. The right panel shows plots of the intensity profiles for the DAPI-channel (blue) and the Cy3-channel (red) along the line indicated in the figure to the left. Cell nuclei are either stained via GFP-Nuc (green) or with DAPI (blue).

