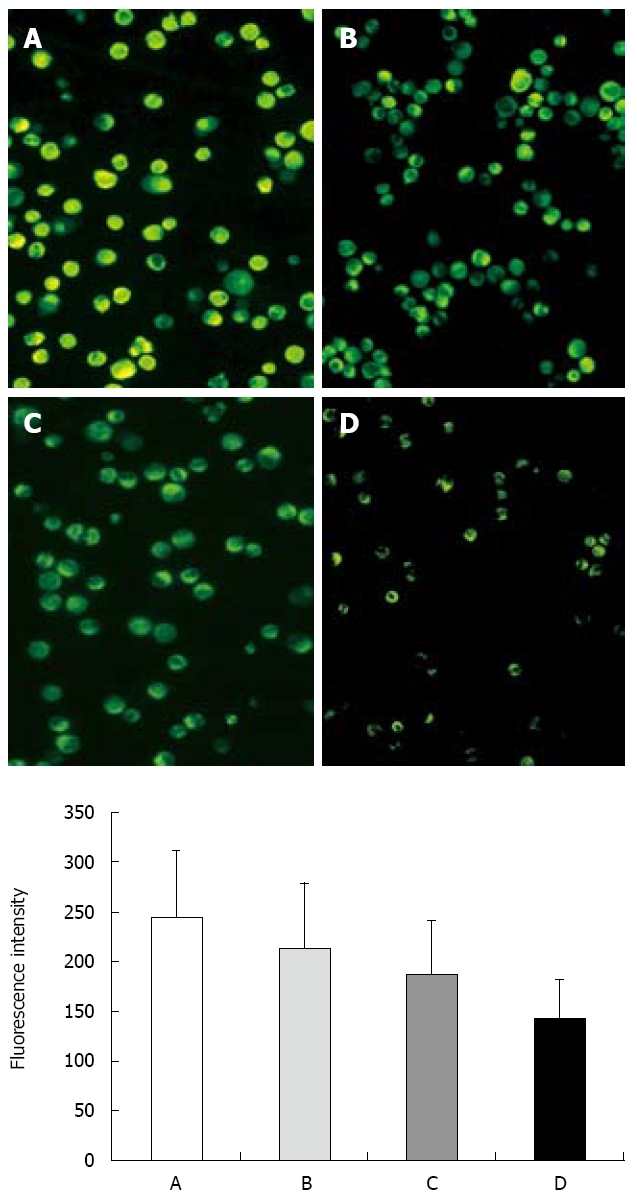
Figure 4.

Effect of ESB on ∆ψm measured with laser scanning confocal microscope by staining with Rhodamine 123 (200 ×). A: Control group; B: Low ESB dose group; C: Medium ESB dose group; D: High ESB dose group. Fluorescence intensity (FI) indicates membrane potential of mitochondria in the cells. FI was decreased in a dose-dependent manner (P < 0.05, ANOVA analysis).
