Figure 4.

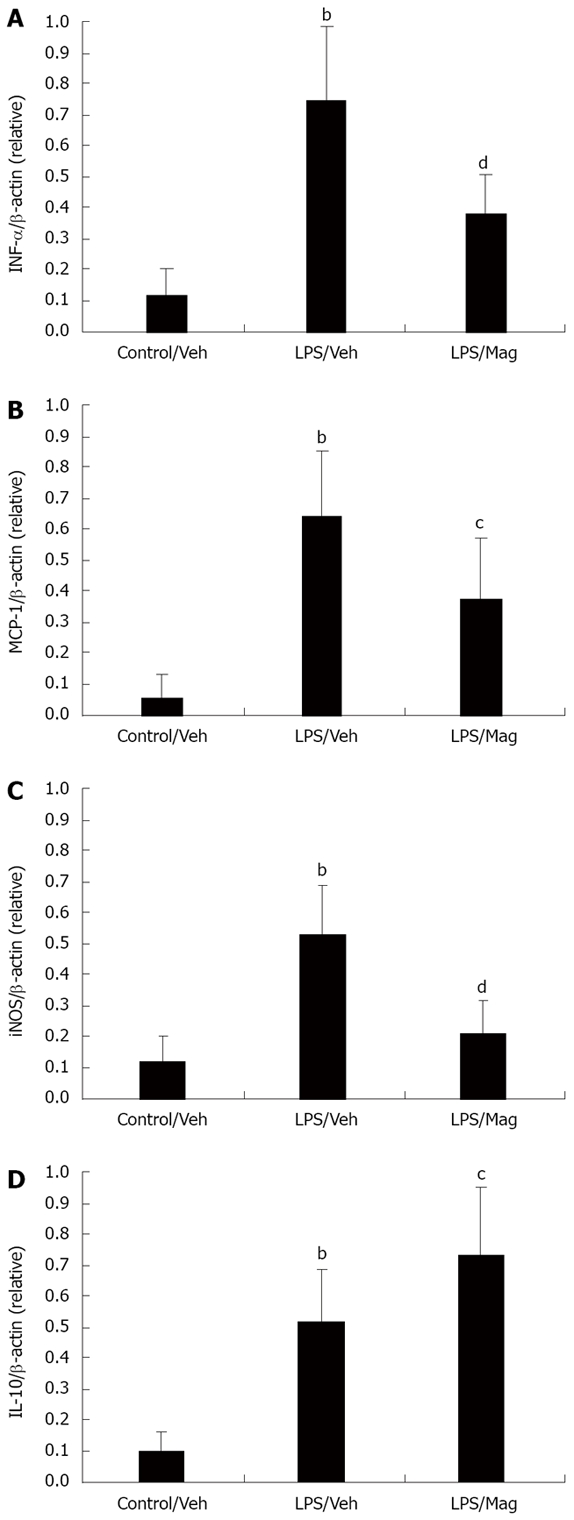
RT-PCR analysis of (A) TNF-α, (B) IL-10, (C) MCP-1, and (D) iNOS mRNA expression in rat ileum. bP < 0.01 (LPS/Veh vs Control/Veh); cP < 0.05 (LPS/Mag vs LPS/Veh) (n = 6); dP < 0.01 (LPS/Mag vs LPS/Veh).

RT-PCR analysis of (A) TNF-α, (B) IL-10, (C) MCP-1, and (D) iNOS mRNA expression in rat ileum. bP < 0.01 (LPS/Veh vs Control/Veh); cP < 0.05 (LPS/Mag vs LPS/Veh) (n = 6); dP < 0.01 (LPS/Mag vs LPS/Veh).