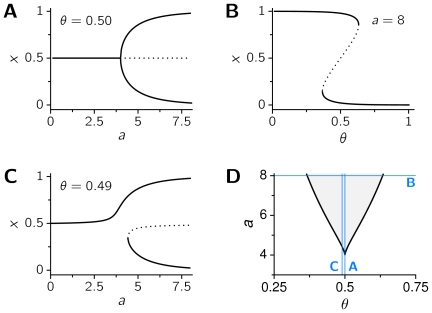
Figure 1. Bistability in a one-dimensional rate model.
The rate model described by Equations (1)–(3) has two stable fixed points for some values of the parameters  and
and  . A, B, and C: Location of the fixed points as a function of
  , for
, for  (A) and
  (C), and as a function of
  , with
  (B). Solid curves correspond to stable fixed points, and the dotted curves to unstable fixed points. D: Regions of monostability (white) and bistability (gray) in the parameter space
  . Blue lines show the sections of the parameter space represented in the bifurcation diagrams A–C.

