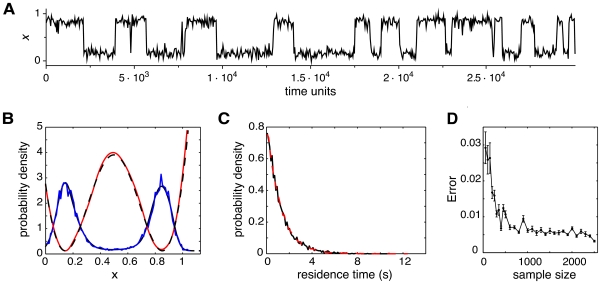
Figure 2. Statistical properties of the one-dimensional, bistable rate model in the presence of noise.
A: Stationary distribution of the rate variable  of the system (1)–(3) with parameter values
  ,
,  ,
,  . Blue: normalized histogram of the simulated data. Black: maximum likelihood fit of the stationary distribution, using a piecewise quadratic approximation. Red: estimated energy function. Black dashed: original energy function. B: Distribution of the residence times in each of the attractors. Due to the symmetry of the system when
  , the two attractor states share the same statistical properties; here we show only the distribution of residence times in the left attractor,
  . Red and black curves are, respectively, the distributions estimated from the original stochastic Equation (1) and from the reconstructed system. C: Error in the estimation of the true energy function, as a function of the number of data points. Error bars are mean squared errors.

