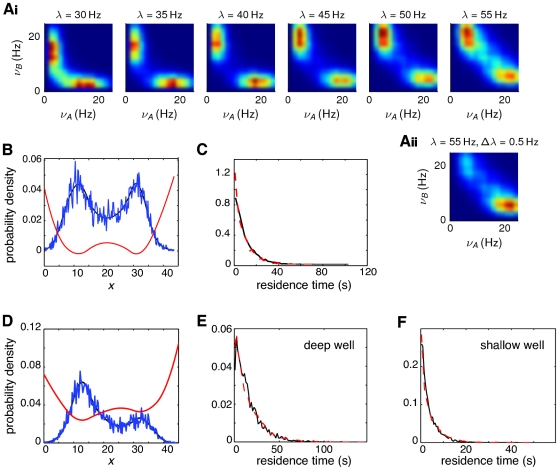
Figure 4. Extraction of the effective parameters from data generated by a winner-take-all network of spiking neurons.
A: Estimated probability density functions of the population rates  . (Ai): symmetric network with balanced external inputs (
 ) for different values of input intensity
  , indicated at the top of each plot. Aii: unbalanced inputs,
  ,
,  . Probability densities are shown as 2-dimensional histograms of
  bins and Gaussian interpolation. B, and D: Blue: stationary distribution of the projection on the principal component
  of the firing rate
  of a network with symmetric (B) and asymmetric (D) inputs. Black: maximum likelihood fit using a piecewise quadratic approximation. Red: energy function. C, E, F: Distribution of the residence times in the attractor states, for the symmetric (C) and asymmetric cases (E,F). For the asymmetric case, the deep attractor corresponds to the network state where the active population firing at highest rate is the population receiving strongest inputs. Conversely, in the shallow attractor the active population is that receiving weakest inputs. The dashed red curves are the distributions estimated directly from the data, while the solid black curves are the distributions derived from the effective one-dimensional Langevin system.

