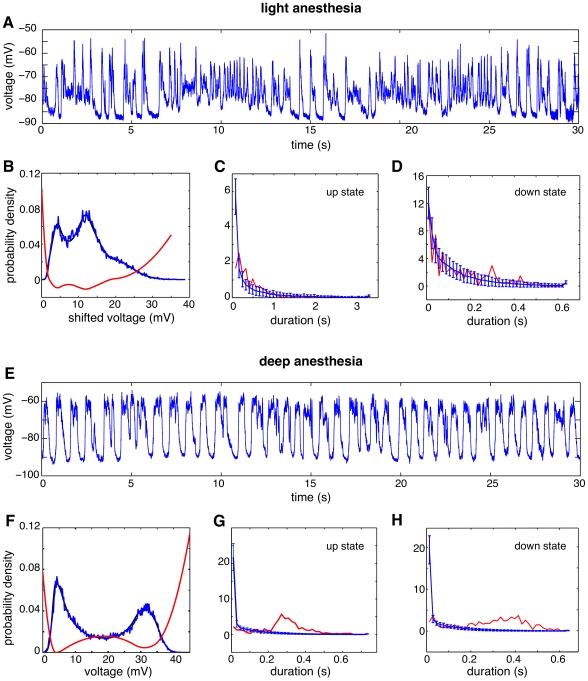
Figure 5. Up and down alternations recorded in vivo in the auditory cortex of a rat under light and deep anesthesia.
A, and E: Trace of the subthreshold membrane potential, measured intracellularly for light (A) and deep (E) anesthesia. B, F: Stationary distribution of the membrane potential  for light and deep anesthesia. Red: energy function derived from the distribution. Black: maximum likelihood estimate. C, D, G, H: Distribution of up-state and down-state durations, for light (C,D) and deep (G,H) anesthesia. Dashed red: experimental data. Solid black: data from simulations.

