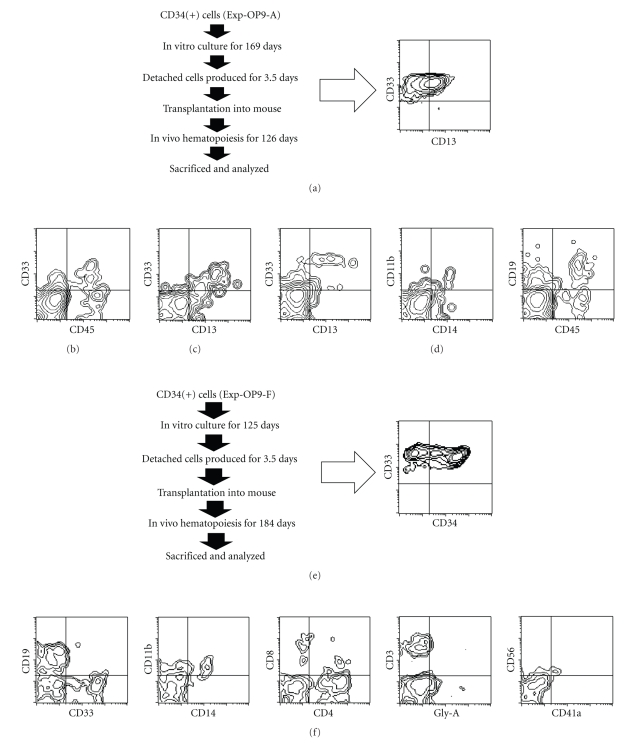
Figure 4.
Flow cytometric analysis of hematopoietic cells of the mouse that had been transplanted with human hematopoietic cells produced by in vitro culture. ((a), (e)) Schema of the experimental procedure and flow cytometric analysis of transplanted cells. ((a)–(d)) Detached cells (3.9 × 10⁶ cells) produced on OP9 feeder cells (Exp-OP9-A) were collected on Day 169 of culture and transplanted into an immunodeficient NOG mouse. Peripheral blood was collected on Days 56 (b) and 112 (c) after transplantation, and bone marrow cells were collected on Day 126 after transplantation (d). ((e), (f)) Detached cells (2.4 × 10⁶ cells) produced on OP9 feeder cells (Exp-OP9-F) were collected on day 125 of culture and transplanted into an immunodeficient NOG mouse. The bone marrow cells were collected on Day 184 after transplantation and were analyzed. ((a)–(f)) The cells were stained using monoclonal antibodies against CD45, a leukocyte common antigen, CD34, a marker specific for hematopoietic stem/progenitor cells, CD33 and CD13, markers of granulocyte and monocyte/macrophage lineage cells, CD11b and CD14, markers of monocyte/macrophage lineage cells, CD19, a marker of B lymphocyte lineage cells, CD3, CD4, and CD8, markers of T lymphocyte lineage cells, Gly-A (Glycophorin A), a marker of erythroid cells, CD56, a marker of large granular lymphocytes and natural killer cells, and CD41a, a marker of megakaryocyte/platelet lineage cells.

