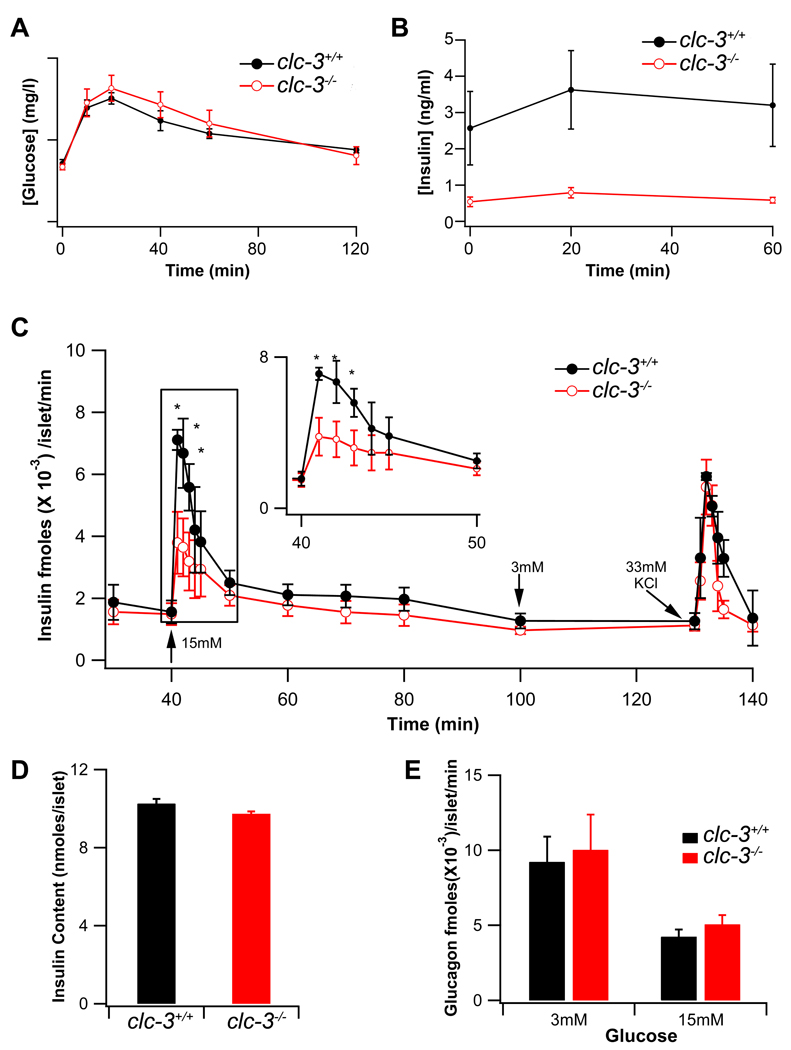
Figure 1. Serum glucose and insulin levels in clc-3−/− mice compared to wild type (clc-3+/+) littermate controls, blunted first-phase insulin secretion in clc-3−/− islets.
(A) Blood glucose levels were measured in whole blood following glucose challenge, nclc-3+/+ = 6, nclc3−/− = 10. Data are plotted as the mean ± S.E.M. (B) Insulin concentration was measured in sera of clc3−/− (n=7) and clc-3+/+ (n=3) mice by ELISA; nclc-3+/+ = 6, nclc3−/− = 10. Data are plotted as the mean ± S.E.M. Note time scale differences in A and B. (C) Insulin release from isolated perifused islets from WT (closed black circles) and KO (open red circles) mice before and after elevating glucose from 3 mM to 15 mM and back to 3 mM. Data are presented in fmoles × 10−3 of insulin/islet/min as means ± S.E.M. (n=3). Asterisks mark significance at the P < 0.05 level. (D) Total insulin content in the lysed islets, measured by ELISA as in (B) and (C). Data are presented in nanomoles of insulin/islet. (E) Glucagon concentration was determined in the same fractions by ELISA. Data are presented in fmoles ×10−3 of glucagon/islet/min as means ± S.E.M. (n = 3).

