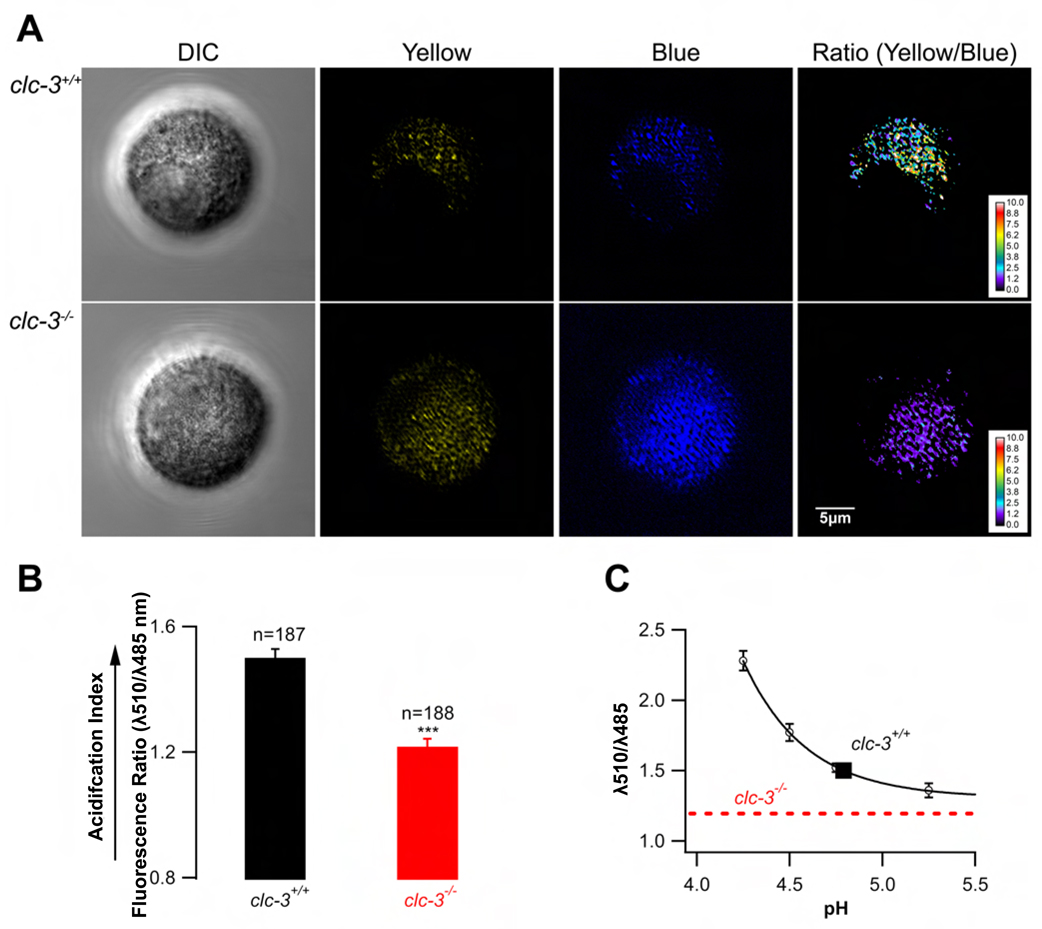
Figure 4. Granule acidification in β–cells isolated from clc-3+/+ and clc-3−/− mice.
Pancreatic β–cells were loaded with the pH-sensitive, ratiometric dye LysoSensor Yellow/Blue DND-160 and visualized with confocal microscopy. (A) Dye-filled vesicles were imaged at the polar focal plane (close to the cell surface to maximize the analysis of secretory granules). The ratio of yellow (pH-sensitive) to blue (pH-insensitive) emission was used to determine organellar pH. (B) Results were analyzed using ImageJ software and presented as mean 510/485 nm fluorescence ratios ± standard errors. (C) In situ calibration curve was used to determine pH values corresponding to 510/485 nm ratios obtained experimentally. The dotted line corresponds to the experimentally obtained fluorescence ratio in clc-3−/− cells. The ratio was significantly less than that of the clc-3+/+ cells and corresponded to the asymptotic part of the pH calibration curve making an estimate of the corresponding pH ambiguous (see text).

