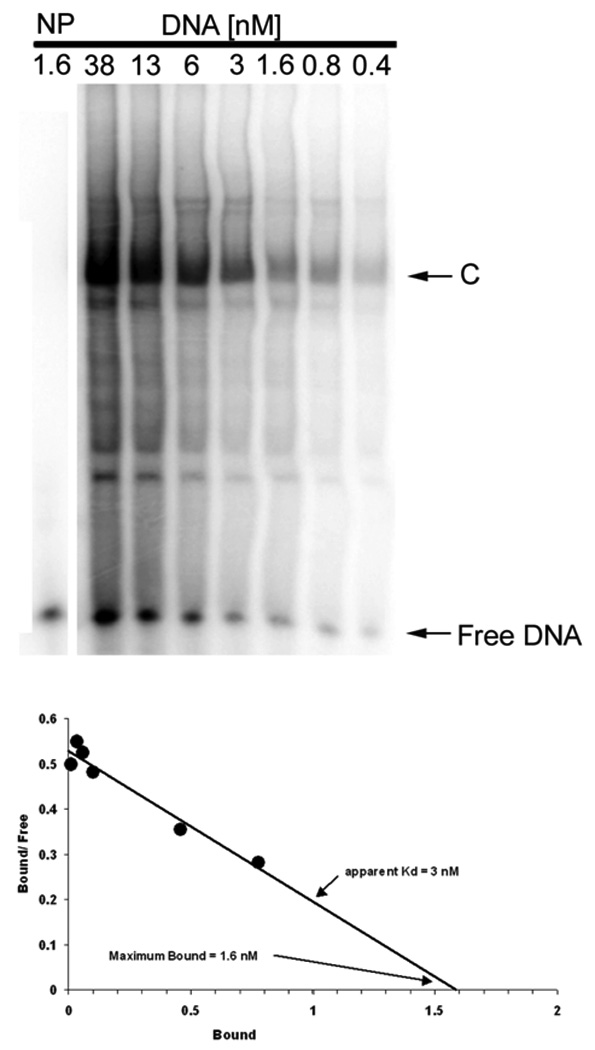
Fig.2.

EMSA determination of the DNA binding affinity. Nuclear extract, 10 fold diluted, was mixed with 2-fold serial dilutions of radiolabeled c-jun WT element for EMSA. The density of the specifically shifted band (C), the Free DNA band, and the total density for each lane (T) are used to calculate the concentration of bound and free DNA for each nuclear extract dilution. Scatchard analysis (lower panel) yields the apparent DNA-binding affinity and concentration of the transcription factor in HEK293 nuclear extract, which shows an estimate of Kd = 3 nM in this experiment for this TF-RE complex (C). The plot also shows the maximum binding (Bmax) of 1.6 nM for a 10-fold dilution nuclear extract, which provides an estimate of 16 nM binding activity in the undiluted nuclear extract. NP, no protein.
