
Figure 3.
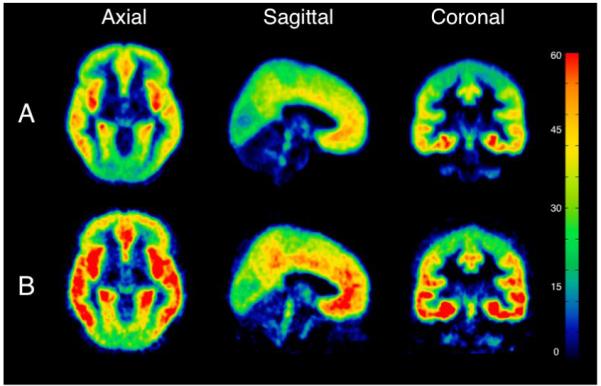
Mean binding potential (BPF) voxel maps for A) the male healthy volunteer group and B) the male bipolar depressed group. Each voxel intensity is the mean of the 5-HT1A BPF measurements for that voxel among each group. The color bar represents 5-HT1A BPF level in mL/cm3.