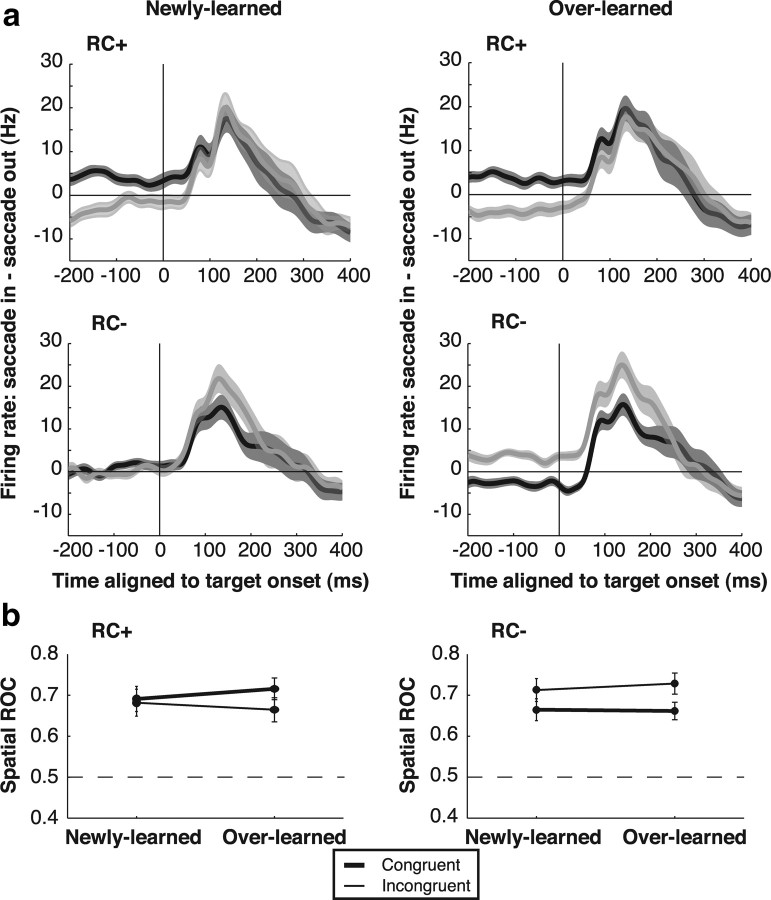
Figure 6.
Spatial effects of the RC on presaccadic activity. a, Difference traces between activity on saccade into the RF and saccade of the RF trials. Trials are sorted by congruence (congruent: black; incongruent: gray) for each RC category and are aligned on the onset of the saccade target. Shading shows SEM. b, ROC for saccade direction 100–200 ms after target onset. All values are significantly more than 0.5 and are thus shown with filled symbols.

