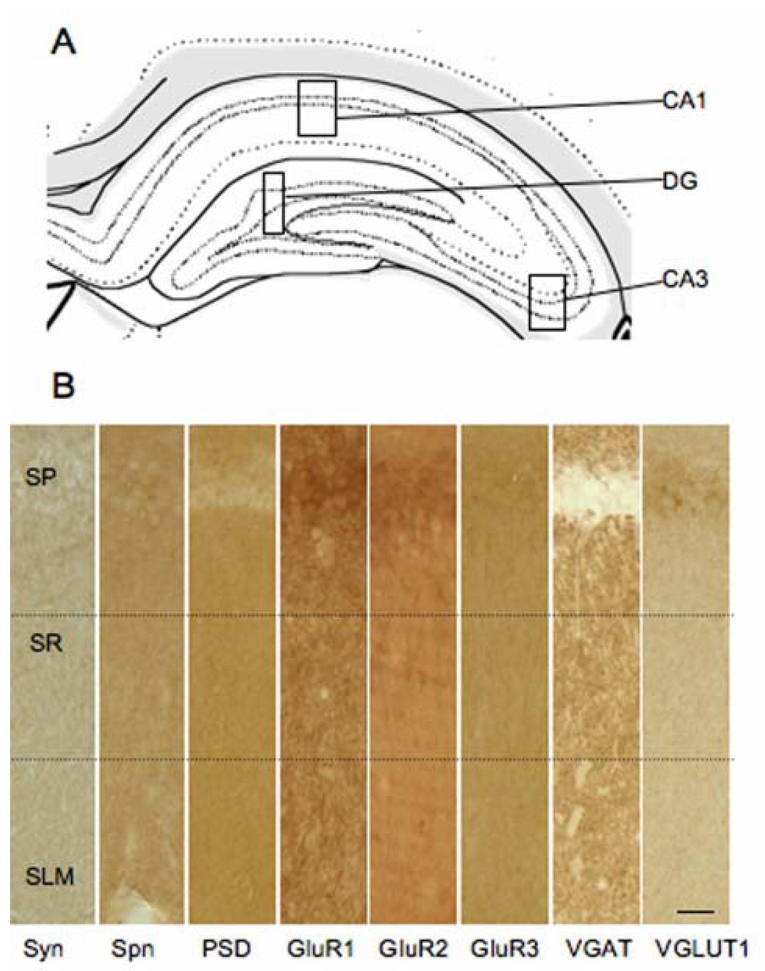
Figure 1.
Examination of synaptic protein expression in the hippocampal formation. A: Schematic representation of hippocampal formation with boxes to demonstrate the areas of the CA1, CA3 and dentate gyrus (DG) analyzed [59]. B: Distribution of synaptic proteins in the CA1 region of the hippocampus. Representative light photomicrographs of synaptophysin (Syn), spinophilin (Spn), PSD-95, GluR1, GluR2, GluR3, VGaT, and VGlut1 peroxidase labeling. Dotted lines demonstrate the medial portion of the stratum radiatum (SR) relative to the strata pyramidale (SP) and lacunosum-moleculare (SLM). Scale bar = 20 µm.

