
Figure 6.
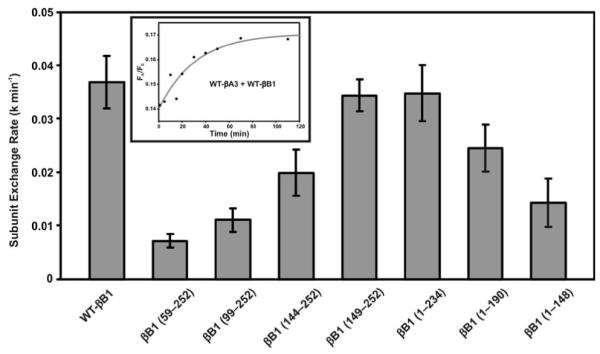
The subunit exchange rates between βB1-crystallin (WT or its mutants) and WT-βA3. The rates were measured using the fluorescence resonance energy transfer (FRET) technique. WT βB1-crystallin and its mutants were labeled with Alexa fluor 350, and these acted as energy donors, and WT βA3, labeled with Alexa fluor 488, acted as an energy acceptor. The fluorescent βB1-350 (WT/mutant) and βA3-488 mixture was prepared in 1:1 ratio, and the subunit exchange was monitored at 37 °C in buffer A (50 mM sodium phosphate, ph 7.5, containing 100 mM sodium chloride and 2 mM DTT) for 2 h. The time-dependent decrease in donor fluorescence and concomitant increase in the acceptor fluorescence were monitored upon exciting the samples at the donor absorption maximum (346 nm). Curve fitting of the raw data using nonlinear regression analysis (using Sigma plot 8.0 software) determined the subunit exchange rate. The inset shows the curve fitting (red line) of the WT-βB1 and WT-βA3 mixture’s raw data (black dots).