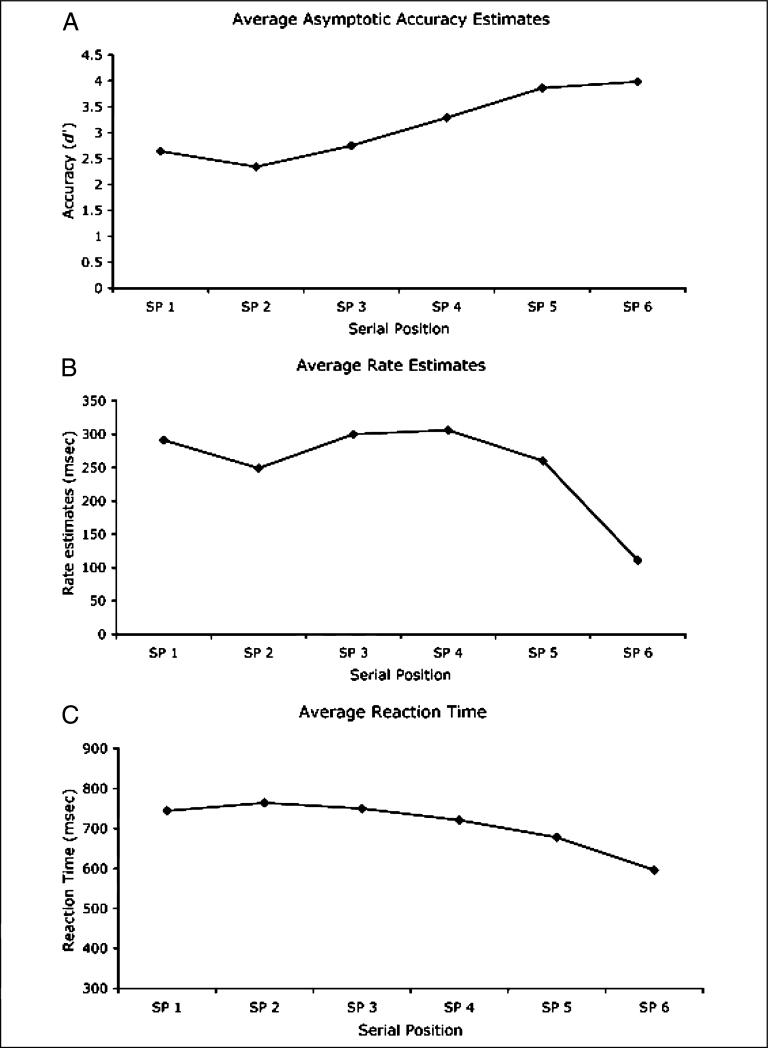
Figure 1.
Illustration of the speed of processing advantage for the last serial position in a speed–accuracy tradeoff (SAT) version of a six-item probe recognition task (A and B), and the corresponding reaction time (RT) patterns for an RT version of the same task (C). The estimates and data from all panels come from experiments reported in McElree and Dosher (1989). (A) The asymptotic accuracy estimates (in d′ units) for each of the six serial positions, which were derived from fits of an exponential approach to a limit retrieval function to the full time-course SAT data (see McElree & Dosher, 1989). These SAT asymptotes reflect the highest level of accuracy obtained with maximal retrieval time, and here exhibit a standard serial position profile, with accuracy increasing as the test probe is drawn from more recent positions, coupled with a modest primacy effect. (B) Rate of informational accrual estimates (msec) that determine the rate of rise of the SAT functions for each serial position. A speed advantage for the last serial position is clearly evident. (C) RT for each serial position from the RT version of the same task. RT patterns largely mirror the asymptotic accuracy patterns in (A) in showing a gradual decline in RT as a function of recency of the test probe. The speed advantage for the last item evident in the unbiased speed estimates shown in (B) also contributes to this RT profile (evidence presented in McElree & Dosher, 1989), but the sharp discontinuity evident in (B) is masked by overall differences in retrieval strength across serial positions. SP = serial position. The presented data were taken from McElree and Dosher (1989).

