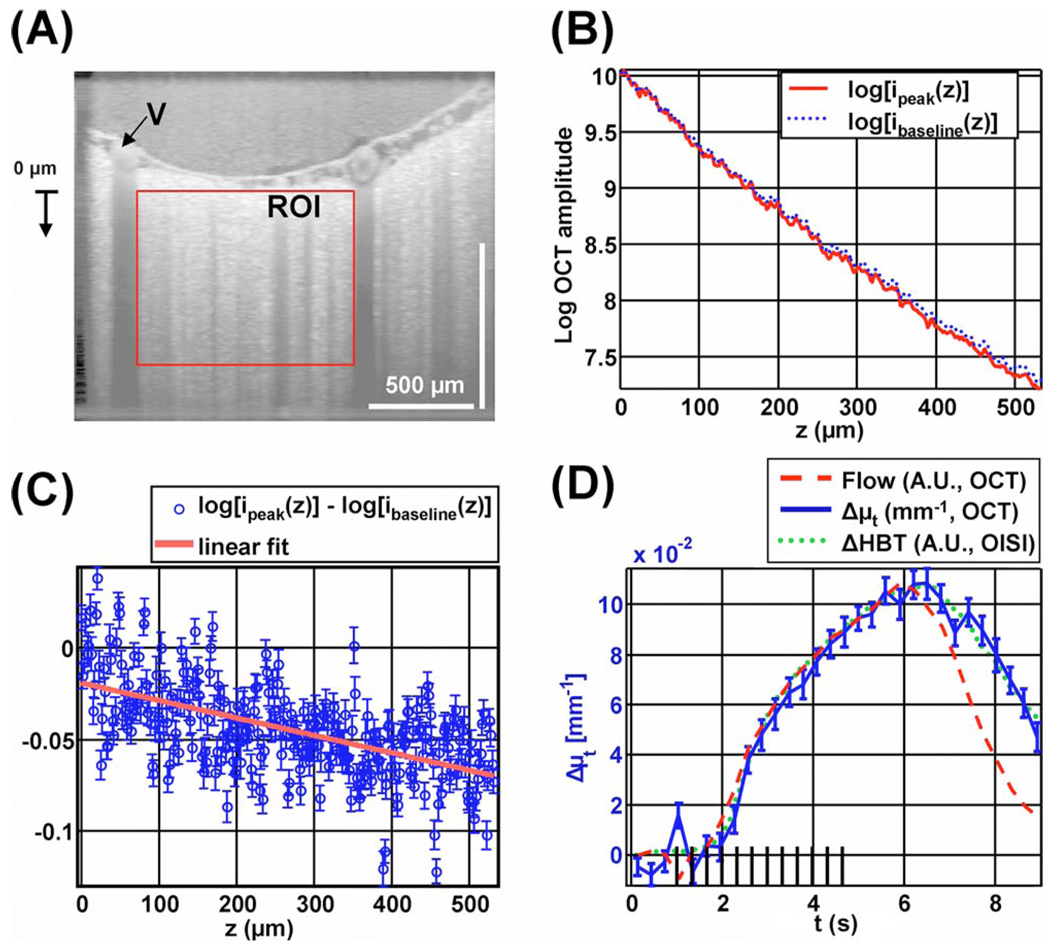
Fig. 3.
(Color online) Extinction coefficient change measured by OCT shows a time course that resembles total hemoglobin. (A) OCT amplitude image on a logarithmic scale, showing a region of interest (ROI) in a capillary bed, and a draining vein (V) near the region of interest. (B) Profile of the natural logarithm of OCT amplitude versus depth, before the stimulus (dotted line) and during peak activation (solid line). (C) Profile of difference between peak activation and baseline, with standard errors and linear fit. (D) Time courses of Δµt measured by OCT (solid curve), flow in the draining vein measured by OCT (dashed curve), and ΔHbT measured by OISI (dotted curve).

