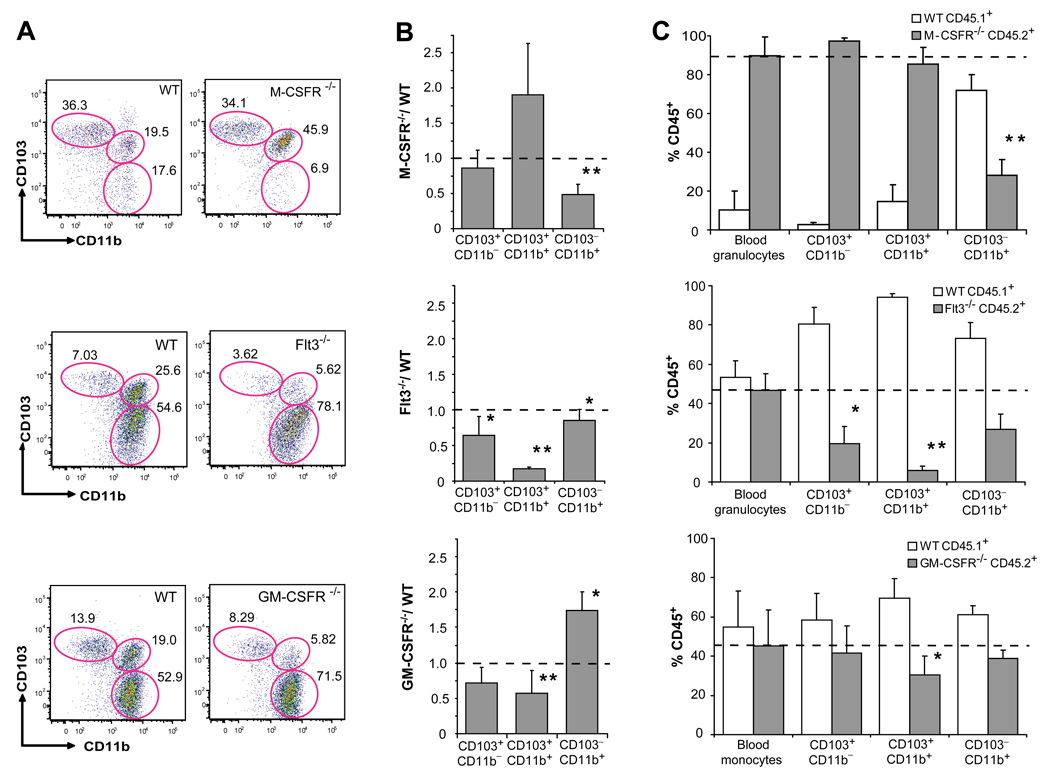
Figure 2. M-CSFR, Flt3 and GM-CSFR control the development of LP DCs.
A. Dot plots show the % of CD103+CD11b−, CD103+CD11b+ and CD103−CD11b+ cells among DAPI−CD45+MHCIIhiCD11chi SB LP DCs in M-CSFR−/−, Flt3−/− and GM-CSFR−/− mice (right panels) or control WT littermates (left panels). PP were excised from the SB of Flt3−/−, GM-CSFR−/− and control littermates, but not from the SB of M-CSFR−/− and their MCSFR+/+ control littermates. B. Bar graphs show the relative change of absolute cell counts among SB LP DC subsets in M-CSFR−/−, Flt3−/− and GM-CSFR−/− mice compared to WT mice. Error bars represent mean +/− SD from 4 (M-CSFR−/−) to 6 (Flt3−/− and GM-CSFR−/−) combined experiments. (*) − 0.05>p>0.005, (**) − p<0.005. C. WT CD45.1+ mice were lethally irradiated and reconstituted with a mixture of 1:1 CD45.1+ WT and CD45.2+ Flt3−/− or GM-CSFR−/− BM cells or with a mixture of 1:10 CD45.1+ WT and CD45.2+ MCSFR−/− fetal liver cells. Bar graphs show the % of CD45.2+ KO and CD45.1+ WT cells among blood cells (granulocytes or monocytes) used as a control and each SB LP DC subset. Error bars represent means +/− SD from 3 simultaneously analyzed experiments. (*) − 0.05>p>0.005, (**) − p<0.005 as compared to the chimerism of blood granulocytes or monocytes.

