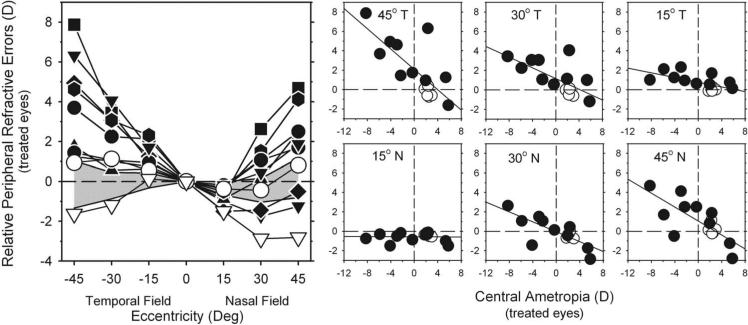
Figure 4.
Left: relative spherical-equivalent refractive corrections (peripheral – central ametropia) of the treated eyes plotted as a function of eccentricity along the horizontal meridian for individual diffuser-reared monkeys at the end of the treatment period. Open triangles: monkey that exhibited central hyperopic anisometropia. Diagonally crosshatched area represents ±2 SD from the mean relative refractive corrections for the control monkeys. Right: relative peripheral refractive corrections of the treated eyes plotted as a function of the central ametropia for each peripheral field eccentricity for the diffuser-reared (filled symbols) and control monkeys (open symbols). Solid lines: best-fitting regression lines.

