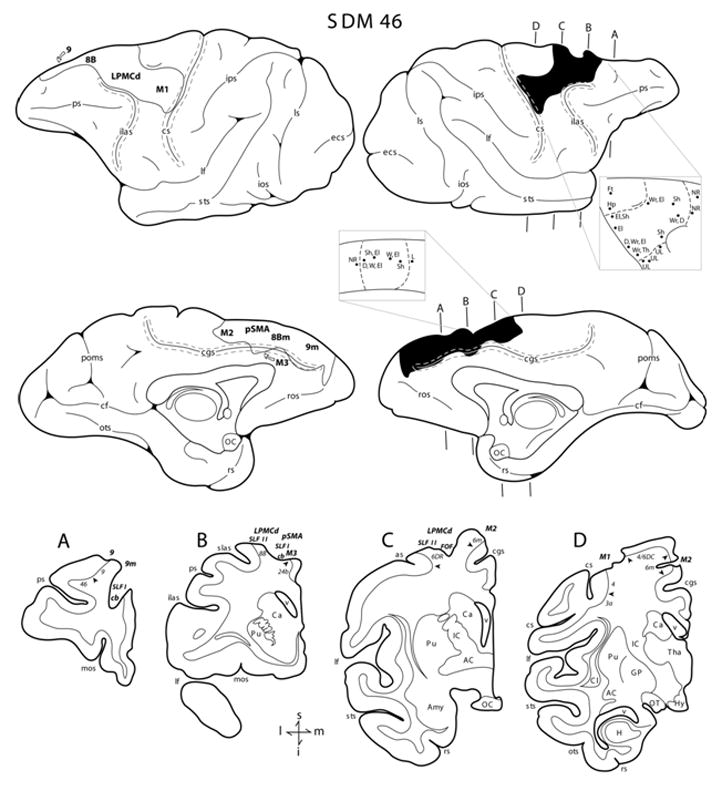
Figure 3.

Line drawings of the lateral and medial surfaces of the hemisphere in case SDM46. Representative coronal sections through the lesioned hemisphere are shown below the medial surfaces. The right hemisphere illustrates the location of the cortical lesion (blackened area) which extended onto the medial wall to the pre-supplementary motor cortex (pSMA), the rostral portion of M2 and prefrontal region (areas 8Bm and 9m). The right hemisphere shows the location of the superimposed lesion (outlined area) that was used to calculate the respective gray and white matter lesion volumes. Coronal panels A through D are through the lesion site in the right hemisphere. In each coronal section, the region of lesioned cortex and involved subcortical pathways are identified by the bold italicized conventions. Pertinent Brodmann’s areas are indicated on the coronal sections immediately below the gray matter and the respective boundaries are identified by the arrow heads. The pullout on the right hemisphere illustrated the microstimulation map. On the map each black dot represents a stimulation point with the affiliated movement(s) observed following stimulation. Abbreviations: D, digit; Ft, foot; Hp, hip; M3, rostral cingulate motor cortex; mos, medial orbital sulcus; NR, no response. For other abbreviations see Figures 1 and 2.
