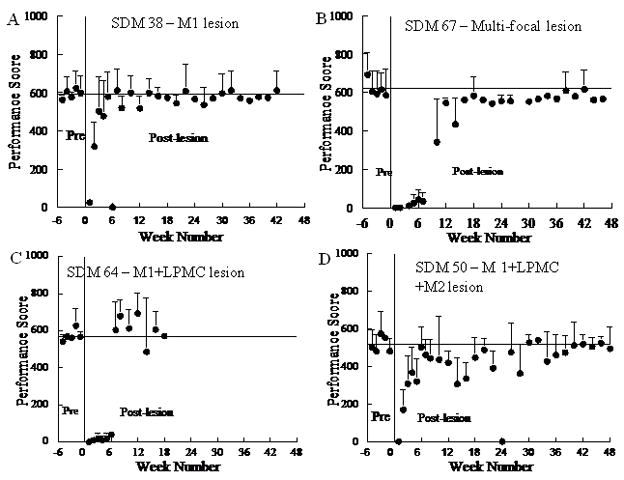
Figure 4.

Pre and post-lesion performance scores on the mMAP curved rod task for 4 monkeys. The solid vertical line shows the time of the surgically induced lesion. The solid horizontal line shows average performance scores for the last 5 pre-lesion tests. Each plotted point is the mean performance score for 5 trials. Error bars are 1 s.d.
