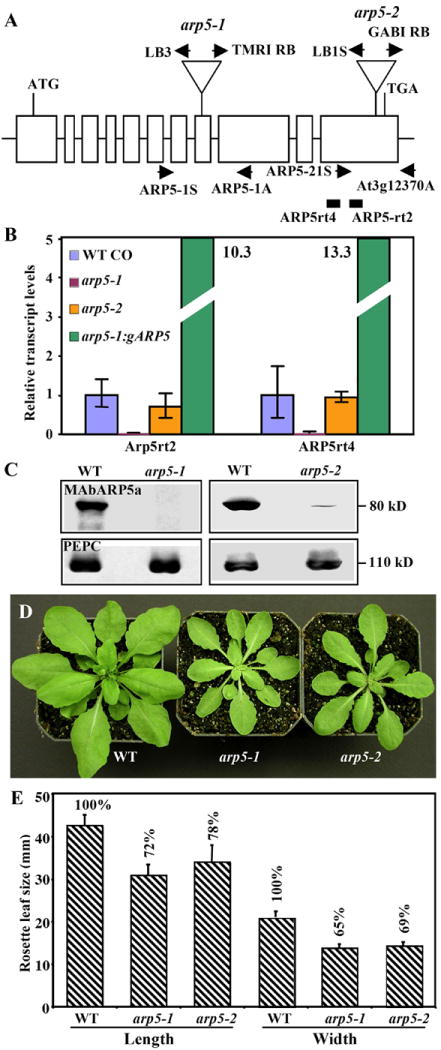
Fig. 3.

Characterization of molecular phenotypes of two ARP5-deficient mutants.
(A) A map of Arabidopsis ARP5 gene indicating the location of T-DNA insertions in the arp5-1 and arp5-2 mutant alleles. Open boxes indicate the 11 exons of ARP5 that encodes a protein of 726 a.a. T-DNA is inserted into the 8th and 11th exons in the arp5-1 and arp5-2 alleles, respectively. The locations of primers used for the genotyping of wild type and mutant alleles by PCR are marked with arrows. The solid rectangles indicate the RT-PCR products obtained while quantifying the transcript levels in (B) using the primers listed in Supplemental Table 1. (B) qRT-PCR analysis of ARP5 transcript levels in 15-day-old seedlings of the two mutant alleles and a complemented arp5-1 plant expressing gARP5. The data represent average values of two technical replicates and the bars correspond to standard deviation (SD). (C) Western blot analysis of ARP5 protein levels in the two mutants. The upper panels are probed with MAbARP5a and the lower panels are probed with anti-PEPC antibody. (D) Morphology of 32-day-old wild type and mutant plants. (E) A bar graph depicting a reduction in leaf size of arp5-1 and arp5-2 mutant plants compared to wild type (Bars indicate SD values).
