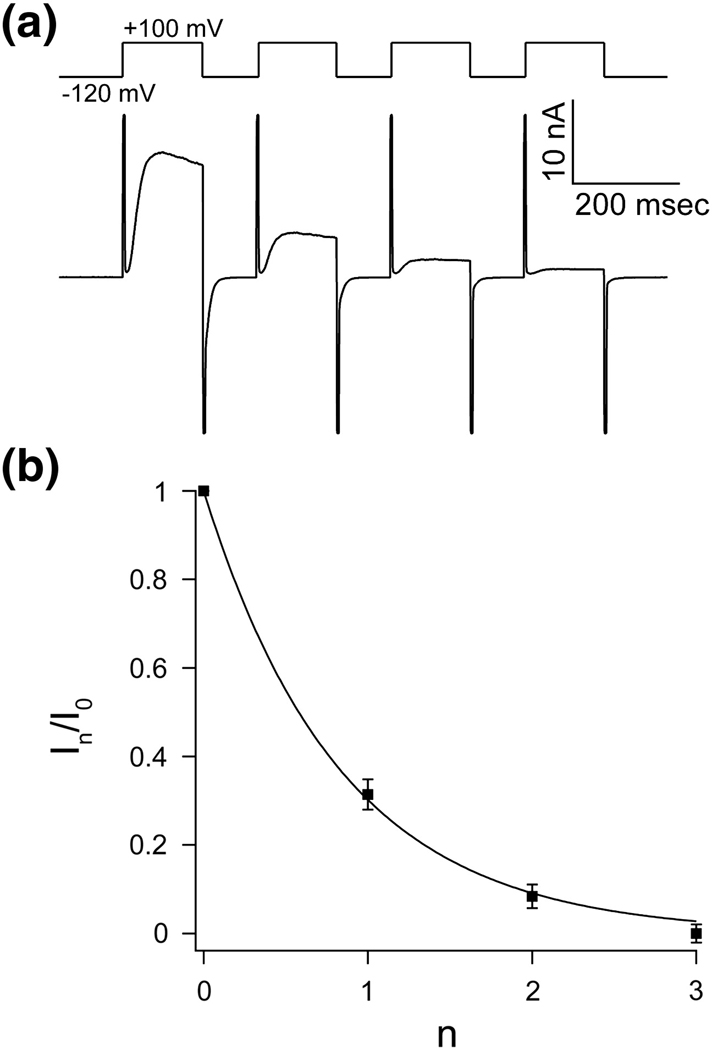
Figure 2. The accumulation of inactivation between pulses follows a geometric series.
A, Repetitive pulse from holding voltage −120 mV to +100 mV. Accumulation of inactivation can be seen between pulses as a fractional decrease in current that is larger than the inactivation that occurred during the previous pulse. B, The fractional decrease in peak current (mean In/I0 ± s.e.m, n = 5) during depolarization as function of number of pulses (n) can be fitted to a geometric progression In/I0 = A n with A = 0.302 ± 0.01.

