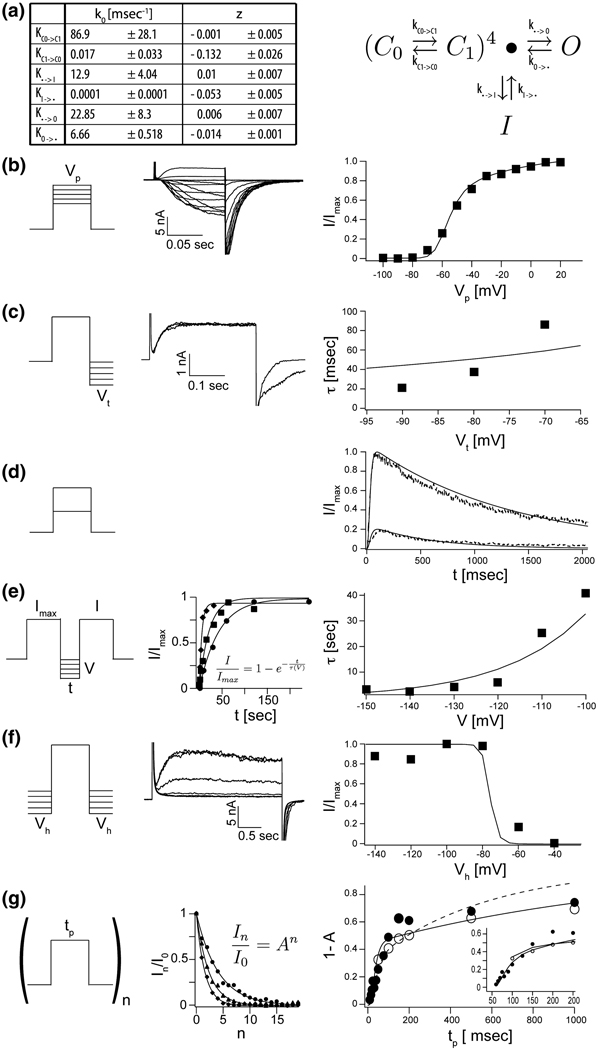
Figure 4. A detailed kinetic gating scheme for KvAP in POPE:POPG.
A, The rate constants an their voltage dependences (± estimated standard deviations, see Materials and Methods) as derived from fitted data below for gating scheme (4) (see text). B–G, The solid lines in each right panel represent numerically modeled data using parameters from table A. Unless otherwise noted datapoints represent mean values of at least three independent measurements. B, G/V data: A representative family of currents is shown (middle panel) for voltage pulses from a common holding voltage (−100 mV) to increasingly more positive depolarization voltages (final +20 mV, ΔV 10 mV). Corresponding tail currents (I/Imax) are plotted (right panel). C, Voltage dependence of deactivation: Currents were elicited by stepping from a common holding voltage to a common depolarization voltage. KvAP channels were closed (deactivated) by stepping back to increasingly negative hyperpolarization voltages (−60 mV to −160 mV, ΔV 10 mV). Two representative examples are shown (middle panel). Tail currents were fitted single exponential functions and the fitted values for τ plotted as a function hyperpolarization voltage (right panel, n = 1). D, Fractional current response (I/Imax, dotted line) after prolonged depolarization to +20 mV and +100 mV respectively. E, Recovery from inactivation: Paired 200 ms depolarization pulses to +100 mV with increasing interpulse length were used to determine the fractional recovery of channel activity (I/Imax) at different holding voltage (−100 mV to −150 mV, ΔV 10 mV) during the interpulse. All channels were completely inactivated at the end of the first of the paired pulses. The fractional recovered currents are plotted as a function of interpulse length (representative examples, middle panel) a fitted to single exponential functions. The fitted values for τ are plotted as a function of interpulse holding voltage (right panel). F, Steady State inactivation: From increasingly more negative holding voltages (−40 mV to 140 mV, ΔV 20 mV), currents were elicited by stepping to a common depolarization voltage. Representative recordings are shown (middle panel). Fractional elicited current (I/Imax) are plotted as a function of holding voltage (right panel). G, Repetitive pulse of varying length tp from a holding potential of −100 mV to +20 mV or +100 mV. Exemplary data for the fractional decrease in peak current I/Imax during depolarization as function of number of pulses (n) is shown (middle panel) for pulses to +100 mV and three different pulse lengths (100, 150 and 200 ms). The solid line represents a fit to I/Imax = An. The fraction of inactivated channel 1 – A is plotted (right panel) against pulse length tp for depolarization pulse to +20 mV (closed circles) and +100 mV (open circles).

