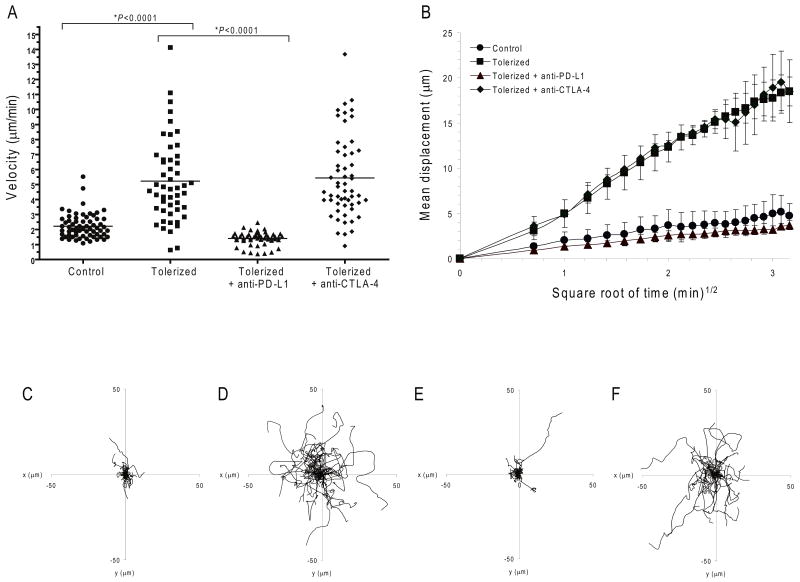
Figure 2. PD-1-PD-L1 but not CTLA-4 prevents the T cell stop signal.
Dynamic migration of BDC2.5 diabetogenic CD4+ T cells in PLN. CMTMR-labeled control or tolerized BDC2.5 T cells were injected into NOD.CD11c-YFP recipient mice. (a-f) Multi-photon image analysis of T cells in islet antigen-containing PLN. (a) Mean velocity of adoptively transferred BDC2.5 T cells in mice subsequently injected with anti-PD-L1, anti-CTLA-4 or isotype control antibody. Horizontal lines illustrate the mean velocity for each group. (b) Mean displacement of BDC2.5 T cells plotted against the square root of time. Shown is the mean of multiple imaging data sets from PLN of mice receiving control T cells, tolerized T cells with isotype control antibody, tolerized T cells with anti-PD-L1, and tolerized T cells with anti-CTLA-4. Data show mean ± s.d.. A time-lapse recording corresponding to this region is shown for each group in Supplementary Movies 1-4. (c-f) Superimposed 10 min tracks of 40-60 randomly selected T cells from each treatment group in the xy plane, setting the starting coordinates from the origin 0,0. Units are in micrometers. Each line represents the path of one cell. Data are representative of three or more independent experiments.

