
Figure 5. PD-L1 blockade promotes prolonged T cell-DC interactions and T cell activation.
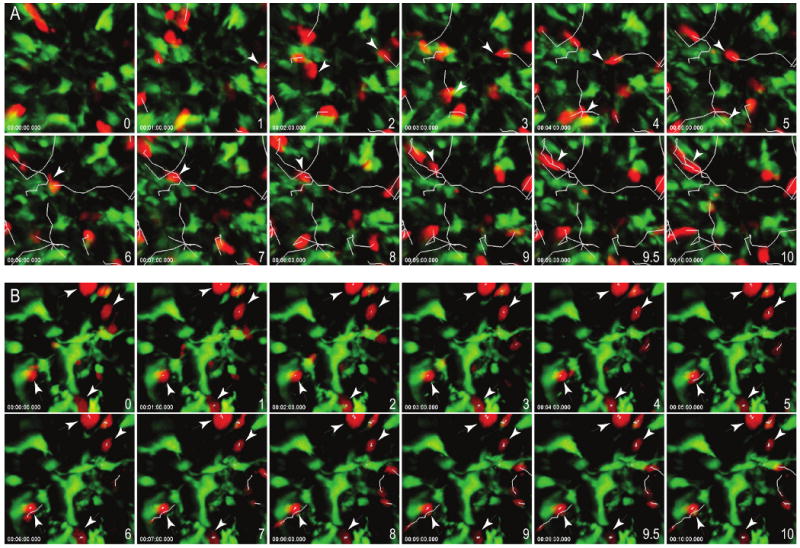
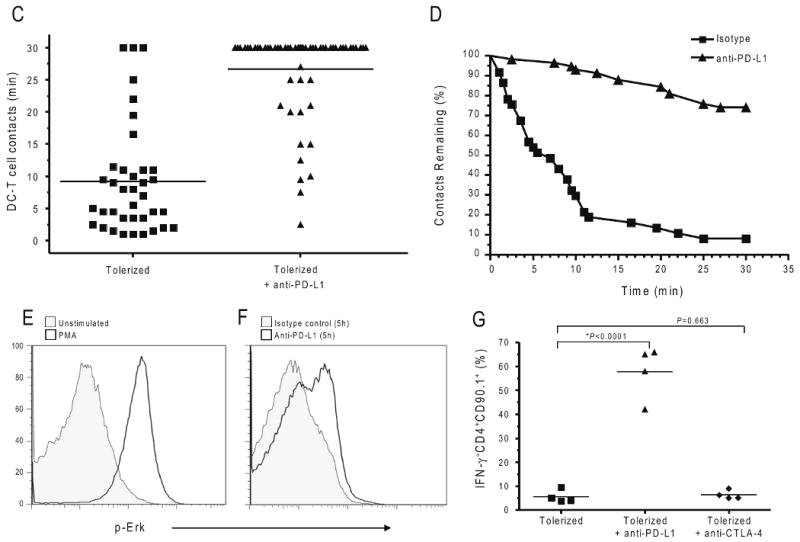
Time-lapse images of contacts between CD11c+ DC (green) and BDC2.5 T cells (red) from the PLN of (a) isotype control or (b) anti-PD-L1 treated recipients. Scale bars, 15 μm. Corresponding time-lapse recordings are shown in Supplementary Movies 13-16. (c) Contact times between antigen-specific tolerized T cells and antigen-bearing CD11c+ DCs following injection of isotype control antibody or anti-PD-L1. Each symbol represents an individual cell. The mean from each group is shown as a horizontal line. (d) Contact time decay curves illustrate the percentage of total T cell-DC contacts remaining after injection of isotype control or anti-PD-L1 antibody over time (min). (e) Intracellular phosphorylated Erk expression in tolerized BDC2.5 T cells that were isolated and left unstimulated or stimulated with PMA. (f) Intracellular phosphorylated Erk expression in tolerized BDC2.5 T cells directly ex vivo from mice treated with isotype control antibody or anti-PD-L1. (g) PD-L1 blockade restores effector cytokine production within the pancreatic islets. Interferon reporter BDC2.5.Thy1.1.Yeti mice were injected with p31-SP followed by anti-PD-L1, anti-CTLA-4, or isotype control antibody. Three days after antibody treatment, pancreas infiltrating CD4+IFN-γ+ (YFP+) cells were analyzed by flow cytometry. Shown is the percentage of CD4+IFN-γ+ BDC2.5 T cells. Data are representative from at least three independent experiments except (f) which was from two independent experiments.