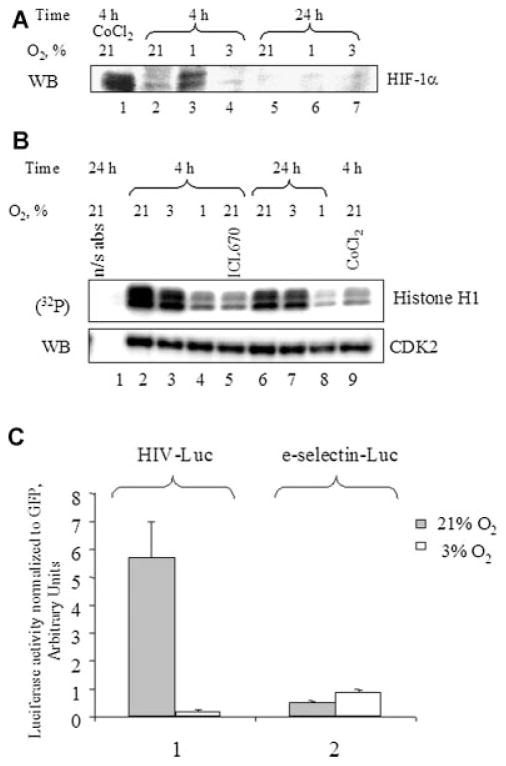
Fig. 5.
Effect of O2 concentration on HIF-1α, CDK2, and NF-κB. A: EffectofO2 concentration on the expression of HIF-1α.293Tcellswere grown at 21% O2, 3% O2, or 1% O2 for the indicated amount of time. Where shown, the cells were treated with 0.3 nM CoCl2. The equal amount of protein lysate was resolved on 10% SDS–PAGE and immunoblotted with the HIF-1α antibodies. The results are representative of four experiments. B: Effect of O2 concentration on cellular activity of CDK2. 293T cells were grown in 100 mm plates at 21% O2, 3% O2, or 1% O2 for the indicated amount of time. Where indicated, the cells were treated with 100 μM ICL670 or 0.3 nM CoCl2. The cells were lysed and CDK2 was immunoprecipitated as described in Materials and Methods Section. The precipitated material was divided in half and one portion was incubated with histone H1 in the presence of γ-(32P) ATP. Kinase reactions were resolved on 10% SDS–PAGE and exposed to the Phosphor Imager screen. The second half of the precipitated material was resolved on 10% SDS–PAGE and immunoblotted with anti-CDK2 antibodies. Lane 1, preimmune IgGs were used for the immunoprecipitation. The results are representative of three experiments. C: Effect of O2 concentration on NF-κB-driven transcription. 293T cells were transiently transfected with CMV-EGFP reporter in combination with e-selectin-Luciferase (an NF-κB driven promoter), or pNL4-3.Luc.R−E− (HIV-1 promoter). The cells were cultured at21% O2 or3%O2 for48 h. Then the cells were lysed and luciferase activity was measured. In parallel, EGFP fluorescence was measured and used for normalization. The results are representative of three experiments.

