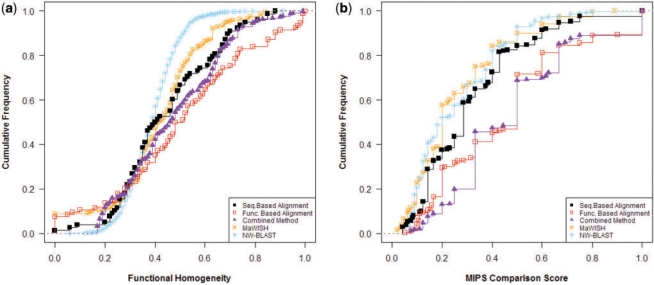
Fig. 2.
Comparison of methods on extracted from the Human network: cumulative frequency distribution of (a) functional homogeneity and (b) MIPS comparison scores. (Results for the simultaneous clustering method not included.) Plots shifted towards right (higher values of functional homogeneity and MIPS score) indicate better results.

