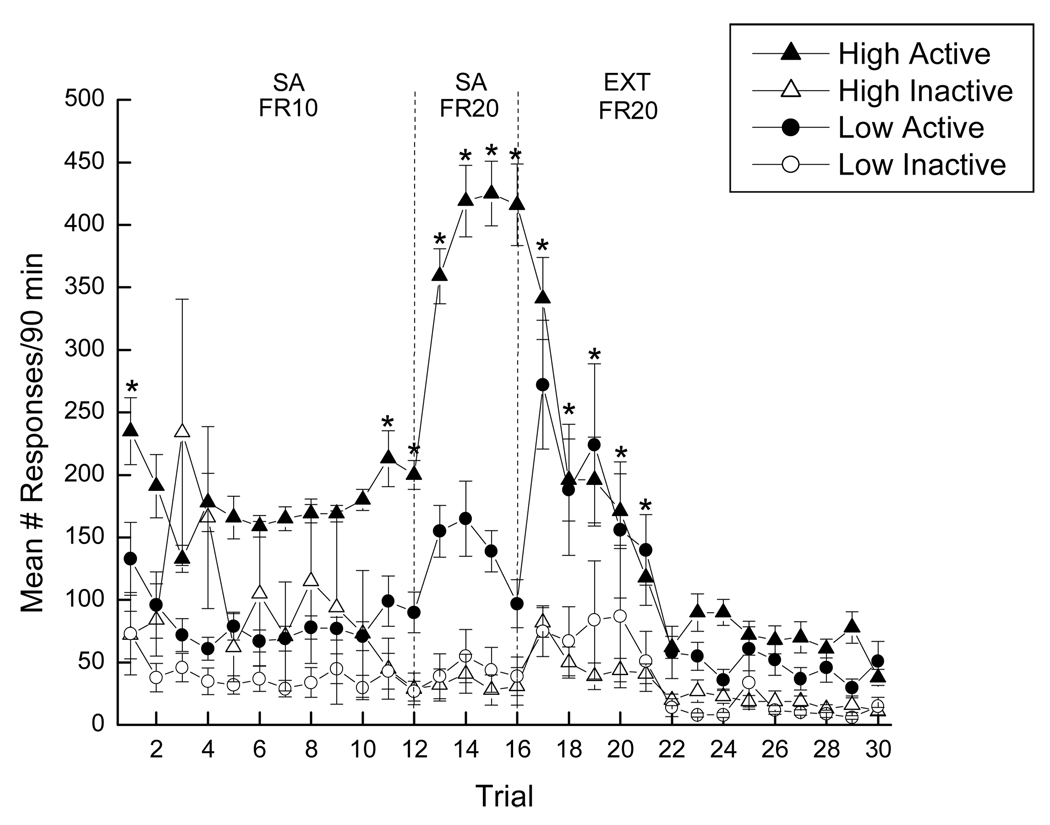
Figure 3.
Mean active and inactive responding throughout self-administration and extinction training. Closed symbols represent active responses, while open symbols represent inactive responses. High drug-takers (n=22) are represented by triangles, while circles represent low drug-takers (n=20). * denotes statistical significance (p < 0.05).

