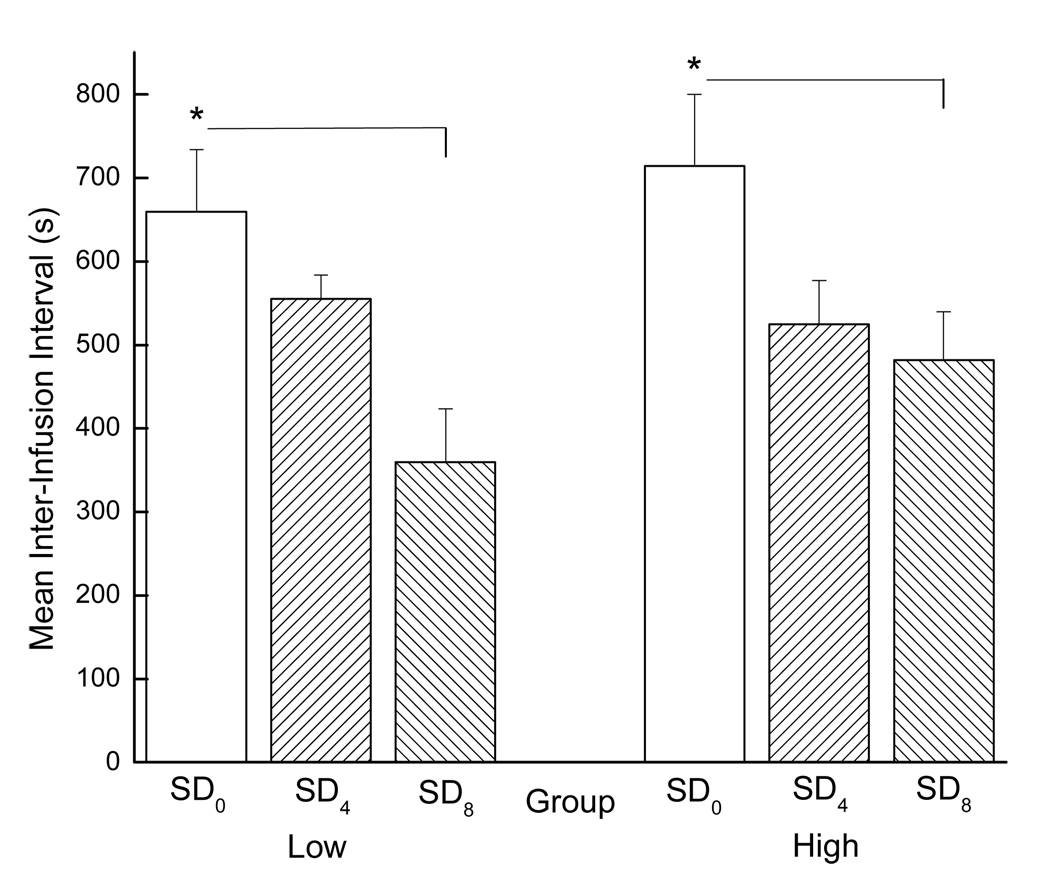
Figure 7.
Mean inter-infusion intervals for low and high drug-taking rats across all SD conditions during PR testing. Low drug-takers (SD0: n=7, SD4: n=6, and SD8: n=7) are shown the left panel and high drug-takers (SD0: n=7, SD4: n=8, and SD8: n=7) are shown in the right panel. * denotes statistical significance (p < 0.05).

