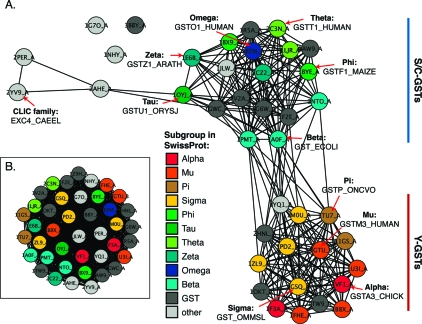
Figure 1.
Cytosolic GSTs fall into two major subgroups based on structural similarity. (A) Structure similarity network, containing 40 structures that are a maximum of 60% identical (by sequence) that span the cytosolic GSTs and some other proteins with similar structures (including Escherichia coli Grx 2, PDB entry 1G7O). Similarity is defined by FAST scores (25) better than a score of 16.0; edges at this threshold represent alignments with a median rmsd of 2.5 Å across 177 aligned positions, while the rest of the edges represent better alignments. Each node is colored by the class of the associated sequence in the SwissProt database (as designated in the key, Swissprot uses the term subgroup to designate GSTs normally designated in the literature as classes). Some sequences are only classified to the GST superfamily (“GST”), and others have no classification or one outside of the GST superfamily (“other”). Each structure is labeled with its PDB entry and chain, and examples from each class are labeled with the entry for the associated sequence in SwissProt. (B) Structure similarity network containing the same structures as in panel A, shown at the less stringent threshold of 7.5. Edges at this threshold represent alignments with a median rmsd of 4.5 Å across 153 aligned positions. Nodes are colored as in panel A.

