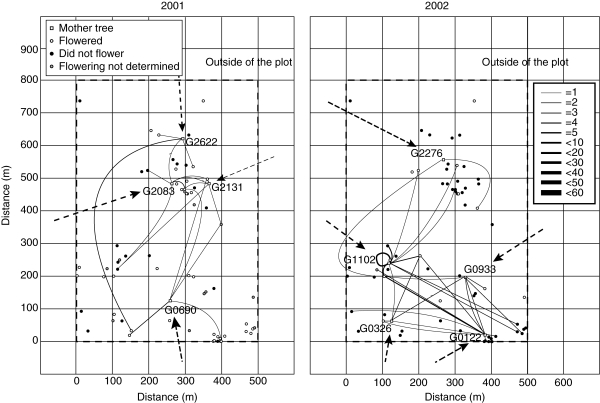
Fig. 2.
The distribution of adult trees (dbh > 30 cm), pollen dispersal routes, and flowering events according to field observations and pollen production estimates derived from the parameter α̂j in Shorea parvifolia. Open squares represent the locations of the mother trees from which seeds were collected (shown with tree IDs); circles represent the locations where adult trees flowered, did not flower and flowering was not determined, as indicated. The lines and arrows show pollen routes within the plot and cryptic pollen dispersal, respectively (from the paternity analysis). The widths of the lines and arrows correspond to the number of pollen dispersal events detected, as indicated in the scale on the right-hand side of the figure.

