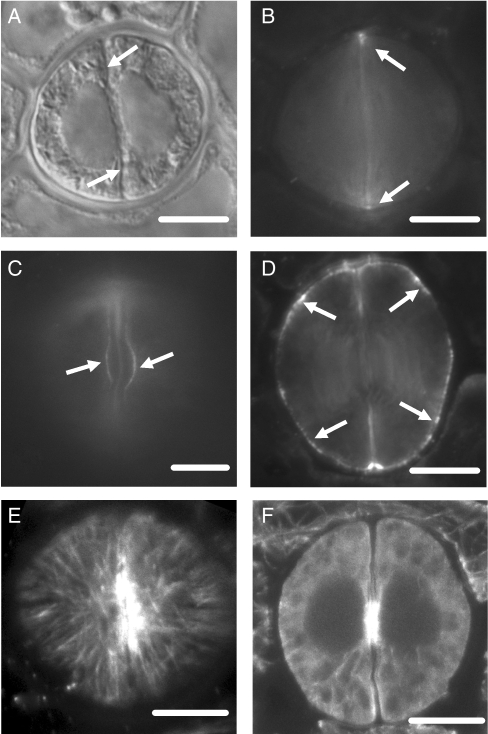
Fig. 11.
CPA-affected stomata as they appear after callose (A–D) or microtubule (E, F) immunolocalization. Treatments: (A–F) 25 µm CPA for 24 h. (A) Differential interference contrast optical view of a post-cytokinetic affected stoma. (B) The stoma after callose immunolocalization. The nascent ventral wall (arrows in A) does not display callose fluorescence (B; cf. Figs 3B and 4A). Weak callose fluorescence is seen at the junction of the ventral wall with the dorsal walls (arrows in B). Scale bar = 10 µm. Optical sections through the external (C) and a median (D) plane of two affected stomata, which are at a differentiation stage similar to that of stomata shown in Fig 3F and H. Weak callose fluorescence is emitted by the stomatal pore region (arrows in C; cf. Fig. 3F, H) and by various positions of the dorsal walls (arrows in D). Scale bars = 10 µm. CLSM sections through the cortical cytoplasm below the external periclinal wall (E) and through a median plane (F) of an affected stoma at an early stage of differentiation, showing the microtubule organization. Scale bar = 10 µm.

