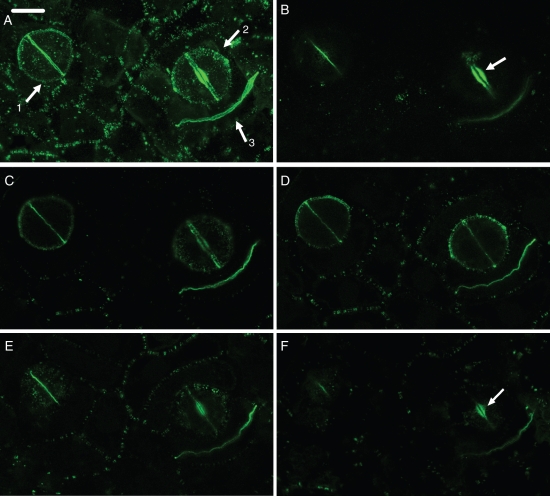
Fig. 4.
(A–F) Paradermal CLSM view of control stomata at an early (arrow 1 in A) and a more advanced (arrow 2 in A) stage of differentiation and a dividing ordinary protodermal cell (arrow 3 in A), after callose immunolocalization. In stoma No. 1 the internal stomatal pore has been initiated, while in stoma No. 2 the deposition of wall thickening has started. (A) Figure produced by projection of 51 CLSM sections. (B–F) Figures produced by projection of four consecutive CLSM sections each. (B) Plane close to the external periclinal walls. (C, D) Median planes. (E, F) Planes close to the internal periclinal walls. For determination of the external and internal periclinal walls see Fig. 1A. The ventral wall emits intense callose fluorescence at regions close to the periclinal walls (B, E), while the nascent daughter wall of the protodermal cell emits intense callose fluorescence at central regions (C, D). The arrows in (B) and (F) indicate the wall thickenings at the stomatal pore region. Scale bar = 10 µm.

