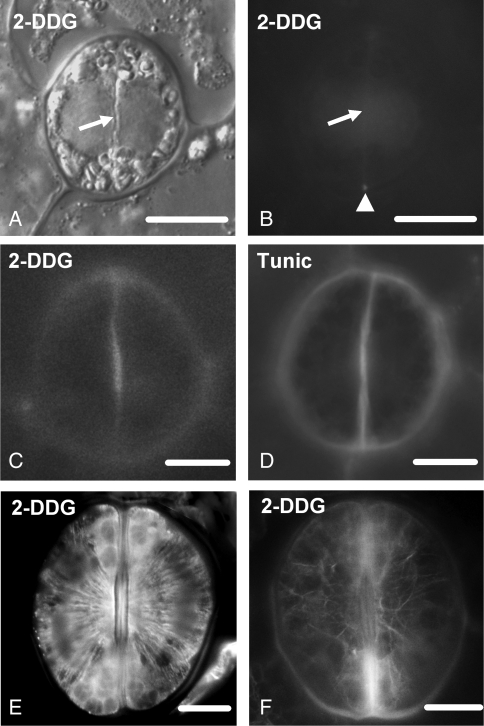
Fig. 6.
(A) Differential interference contrast optical view of a post-cytokinetic 2-DDG-affected stoma. The arrow shows the nascent ventral wall. (B) The stoma after callose localization with aniline blue staining. The nascent ventral wall (arrow) does not display callose fluorescence (cf. Fig. 3B). Weak callose fluorescence is emitted by the junctions of the ventral wall with the dorsal walls (arrowhead). Treatment: 1 mm 2-DDG for 48 h. Scale bar = 10 µm. (C, D) Callose localization after aniline blue staining in a 2-DDG- (C) and a tunicamycin-affected (D) differentiating stoma. Treatments: (C) 1 mm 2-DDG for 48 h; (D) 24 µm tunicamycin for 48 h. Scale bars = 10 µm. (E, F) Microtubule immunolabelling (E) and actin filament staining (F) with Alexa Fluor 568 phalloidin in 2-DDG-affected differentiating stomata. Treatment: 500 µm 2-DDG for 72 h. Scale bars = 10 µm.

